background image


3.  Perform the single trigger measurement with the DUT by pressing Display Format hardkey 

> LIST SWEEP softkey > Trigger hardkey 


4. 

Open “E4980A_DataTransfer_xxxx.xls” on the PC. Since this file contains macros, enable 

“Macros” to boot the program, then follow the “Step-1” and the “Step-2” in the “Main” sheet. 


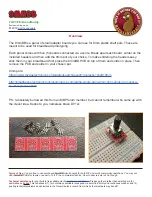
5.  On the newly created sheet, choose the graph parameter to show the graph properly 

( X/Y-axis are changed to Log format in the example below) 


Summary of Contents for E4980A

Page 1: ...Agilent E4980A Precision LCR Meter E4980A Data Transfer Program Operation Manual Rev 01 20 July 2011 ...

Page 2: ...clusively for their own purpose and shall not license lease market or distribute the SAMPLE PROGRAMS or modification of any part thereof Agilent Technologies shall not be liable for the quality performance or behavior of the SAMPLE PROGRAMS Agilent Technologies especially disclaims any responsibility for the operation of the SAMPLE PROGRAMS to be uninterrupted or error free The SAMPLE PROGRAMS are...

Page 3: ...ng cables 1 USB cable type mini B for E4980A side and type A male for PC side furnished as an E4980A standard accessory 2 Agilent 82357A or 82357B USB GPIB Interface 2 Connection configuration through Agilent Connection Expert 1 Run Agilent Connection Expert by double clicking the icon in the task tray Double click 2 Connect the E4980A and the PC using either USB cable or USB GPIB interface Then t...

Page 4: ...nsation The E4980A can sweep frequency test signal level DC bias signal level DC source level up to 201 points with the list sweep function by pressing Meas Setup hardkey LIST SETUP softkey 2 Set the trigger to manual mode by pressing Meas Setup hardkey then cursor down to the TRIG field to select MAN ...

Page 5: ...er hardkey 4 Open E4980A_DataTransfer_xxxx xls on the PC Since this file contains macros enable Macros to boot the program then follow the Step 1 and the Step 2 in the Main sheet 5 On the newly created sheet choose the graph parameter to show the graph properly X Y axis are changed to Log format in the example below ...

Page 6: ... 01 20 2011 7 5 Function added to return to local mode automatically Function added to show measurement mode as graph title Evaluated under Windows 7 and Excel 2010 environment Other minor improvements implemented 01 00 2010 2 22 Initial revision ...

Reviews: