32
33
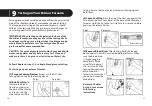
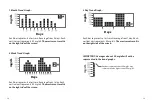
About averages and standard deviations:
Control solution, out-of-temperature-range results, and results
without a valid time or date are not included in averages,
standard deviations, and trend graphs. Hi and Lo test results will
be included in averages as values of 600 mg/dL and 20 mg/dL
respectively. 14, 30, and 90 day averages and trend graphs
are calculated by taking the average of all readings within the
respective time period. Standard deviations, averages, and trend
graphs do not include the current day in their calculations.
The standard deviation is an expression of the variation of
readings from the average reading. The greater this value the
more variation exists between individual readings and the
average. The standard deviation feature is a way to track your
glucose variability.
[1]
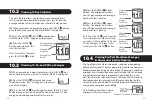
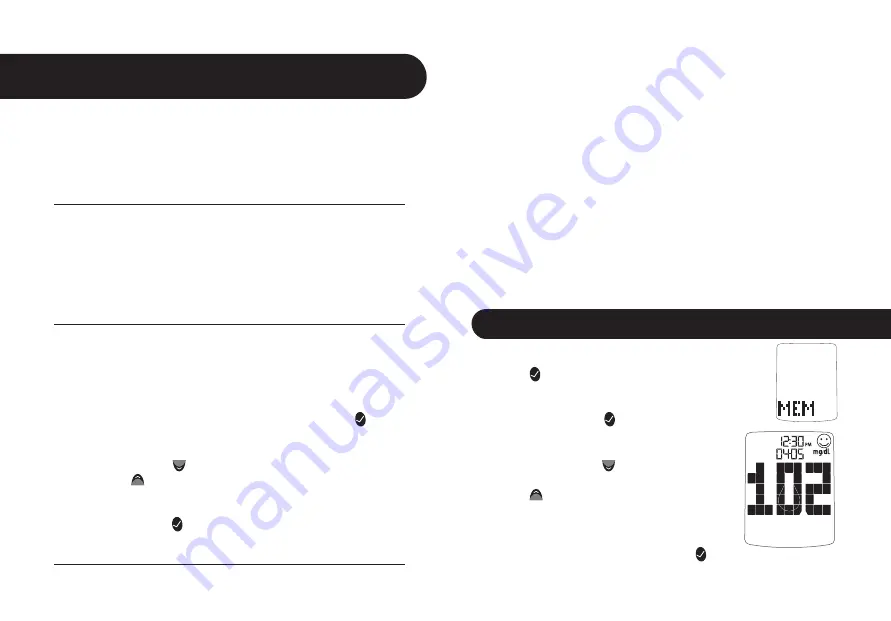
When your meter is deactivated, press the
CHECK ( ) button once to enter menu mode.
The word “MEM” is displayed.
[2]
Press the CHECK ( ) button again to enter
the individual results section.
[3]
Press the DOWN (
) arrow button to
scroll through the individual readings. Press
the UP (
) arrow button to scroll backwards.
Note: When scrolling through, the oldest test re-
sult will cycle back to the most recent test result.
To return to the menu, press the CHECK ( ) button.
Viewing Individual Results
10.1
Data Management Features
10
CHAP
TE
R
IMPORTANT: Results, averages and graphs stored in
memory should only be used as a reference. Do not
make treatment decisions based solely on stored results,
averages and graphs. Consult with your healthcare
professional regarding treatment options.
This chapter covers the steps on how to view your:
• Individual Results (1865 past results, with time and date)
• 14 Day Statistics
• 14, 30, and 90 Day Averages
• Pre/Post Mealtime Averages & Glucose Variability Tracking
• 1 Month, 2 Week, 3 Day Trend Graphs
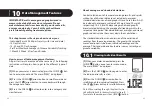
How to access all data management features:
All past test results are accessed the same way. The following
instructions will explain how to get to the different types of
data.
[1]
When your meter is deactivated press the CHECK ( ) but-
ton to enter menu mode. The word “MEM” is displayed.
[2]
Press the DOWN (
) arrow button to scroll forward and
press the UP (
) arrow button to move backward through
the categories of data.
[3]
Press the CHECK ( ) button to enter into a category and
view features.
Summary of Contents for Jazz
Page 1: ...OWNER S GUIDE Advanced Blood Glucose Monitoring System ...
Page 34: ......


