


29
PD201806 AEG GRID-TIED SINGLE-PHASE SOLAR INVERTER V.1-18 EN
29
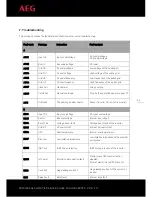
Text Parameter
Display Area
Fault Code
Menu
Status Area
Curve Graphic
Display Area
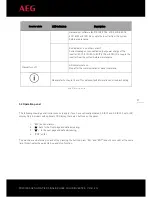
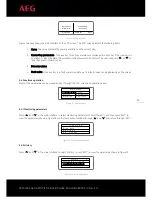
Figure 16: Main interface
Figure 16 above shows the main interface of the LCD screen. The LCD screen displays the following items:
1.
Curve. The curve displays the power generation on the current day;
2.
Current key parameters of the inverter: three lines of words are displayed at a time, but if the inverter is in
operation or stand-by state, the words are rolling forward in 3s interval. The user can press “ ” or “ ” to
look the desired information up;
3.
5 inverter states;
4.
Fault codes. If the inverter is in fault or warning state, up to 8 fault codes can be displaying on the screen.
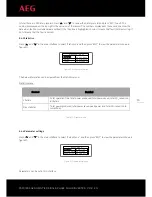
5.4 Functions operation
Most of the parameters can be viewed and set through the LCD screen and operation panel.
M a i n M e n u
M o n i t P a r a m
H i s t o r y
S t a t i s t i c s
S e t u p
S y s t e m I n f o
F a u l t I n f o
Figure 17: Main interface
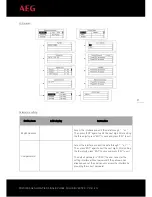
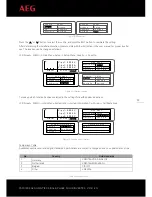
5.4.1 Monitoring parameters
Press “ ” and “ ” in the main interface to select Monitoring Parameters (“Monit Param”), and then press “ENT” to
view the parameters shown in figure 18. Go the front or next window through “ ” and “ ” and return through “ESC”.
C u r r e n t S t a t e
E - t o d : 0 W h
$ - t o d :
€
0 . 0 0
P - i n : 0 . 0 0 k W
Figure 18: Monitoring parameters
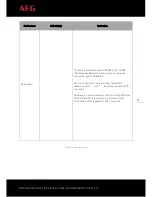
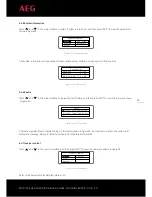
5.4.2 History
Press “ ” and “ ” in the main interface to select “History”; press “ENT” to view the parameters shown in figure 19.
H i s t o r y 0
2 0 1 2/ 0 1 / 0 5 1 1 : 3 2 : 1 6
A 0 0 5 : G r i d u n d e r f r e q
Figure 19: History parameters