−
−
−
−
Fuel economy is not a fixed number.
It varies based on driving conditions,
driving habits, and vehicle condition.
Therefore, it is not possible for one
set of estimates to predict fuel
economy precisely for all drivers in
all environments.
Represents urban
driving in light traffic. A range of
miles per gallon achieved is also
provided.
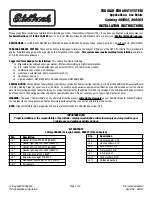
The EPA fuel economy estimates
shown in the example to the right
are a useful tool for comparison
when buying a vehicle. EPA
estimates include:
Represents a combination of city and
highway driving. The scale
represents the range of combined
fuel economy for other vehicles in
the class.
Represents a
mixture of rural and interstate
driving, in a warmed-up vehicle,
typical of longer trips in free-flowing
traffic. A range of miles per gallon
achieved is also provided.
Provides an estimated annual fuel
cost, based on 15,000 miles (20,000
km) per year multiplied by the
cost per gallon (based on EPA
fuel cost data) divided by the
combined fuel economy.
For more information on fuel
economy ratings and factors that
affect fuel economy, visit
(Canada: Visit
)
www.fueleconomy.gov
www. vehicles.gc.ca
Actual Mileage and EPA Fuel
Economy Estimates Comparison.
City MPG
Combined Fuel Economy
Highway MPG
Estimated Annual Fuel Cost
Fuel Economy
476
Combined Fuel
Economy
(Sample U.S. EPA label shown)
Estimated Annual
Fuel Cost
City MPG
Highway MPG
11/01/14 19:17:37 31TK4630_481
B
e
fo
re
D
riv
ing
2012 TL
Summary of Contents for 2012 TL
Page 64: ...60 11 01 14 18 04 23 31TK4630_065 2012 TL I n f o r ma t i o nP r o v i d e db y ...
Page 228: ...224 11 01 14 18 32 45 31TK4630_229 2012 TL I n f o r ma t i o nP r o v i d e db y ...
Page 470: ...466 11 01 14 19 16 08 31TK4630_471 2012 TL I n f o r ma t i o nP r o v i d e db y ...
Page 584: ...580 11 01 14 19 35 42 31TK4630_585 2012 TL I n f o r ma t i o nP r o v i d e db y ...
Page 632: ...628 11 01 14 19 43 41 31TK4630_633 2012 TL I n f o r ma t i o nP r o v i d e db y ...