11-12
IM WT5000-01EN
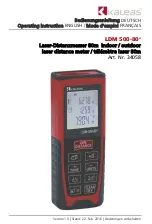
Bar Graph Display (Bar)
You can display harmonics using bar graphs. The harmonic orders are lined up on the horizontal axis, and the
vertical axis represents the amplitude of each harmonic.
You can configure three different bar graphs.
Bar Graph Display Example
The bar graph number, measurement function, element, and upper limit of the
displayed bar graph
The bar graph number, measurement function, element,
and lower limit of the displayed bar graph
Harmonic order range of the displayed bar graph
“log Scale” only appears when logarithmic coordinates are used.
• When logarithmic coordinates are used (Log Scale), if a value is negative, its absolute value is displayed
with a red bar graph.
• If the analysis window width (number of cycles of the fundamental signal) that is determined by the
fundamental frequency is shorter than the data update interval, bar graphs are not displayed. Set a longer
data update interval. For details, see "Notes about the Numeric Data Display."
• The bar graphs of harmonic orders that exceed the maximum measurable order are not displayed. For
information about the maximum measurable harmonic order, see “Maximum Harmonic Order to Be
Measured (Max Order).”
Display Group (Group)
Select the group you want to display from 1 to 4.
To assign waveforms to each group (1 to 4), set the
. For example, if you assign the
functions of elements 1, 2, and 3 to each group, you can easily switch the bar graph displays simply by changing
the display group.
Display Items (Items, Bar)
Bar Graph Number (Item No.)
Select the number, from 1 to 3, of the bar graph that you want to select.
Function (Function)
You can select the measurement function to display from the following options.
U, I, P, S, Q, λ, Φ, ΦU, ΦI, Z, Rs, Xs, Rp, Xp
11 Graph Display