


7-5
IM 704210-01E
Displaying the Measured/Computed Data
7
7.2 Using the Multi-window Function
≡
≡
≡
≡
≡
For a description of the function, refer to 1.6
≡
≡
≡
≡
≡
P r o c e d u r e
• To exit from the current menu, press any of the top menu keys or press the ESC touch key
displayed on the screen.
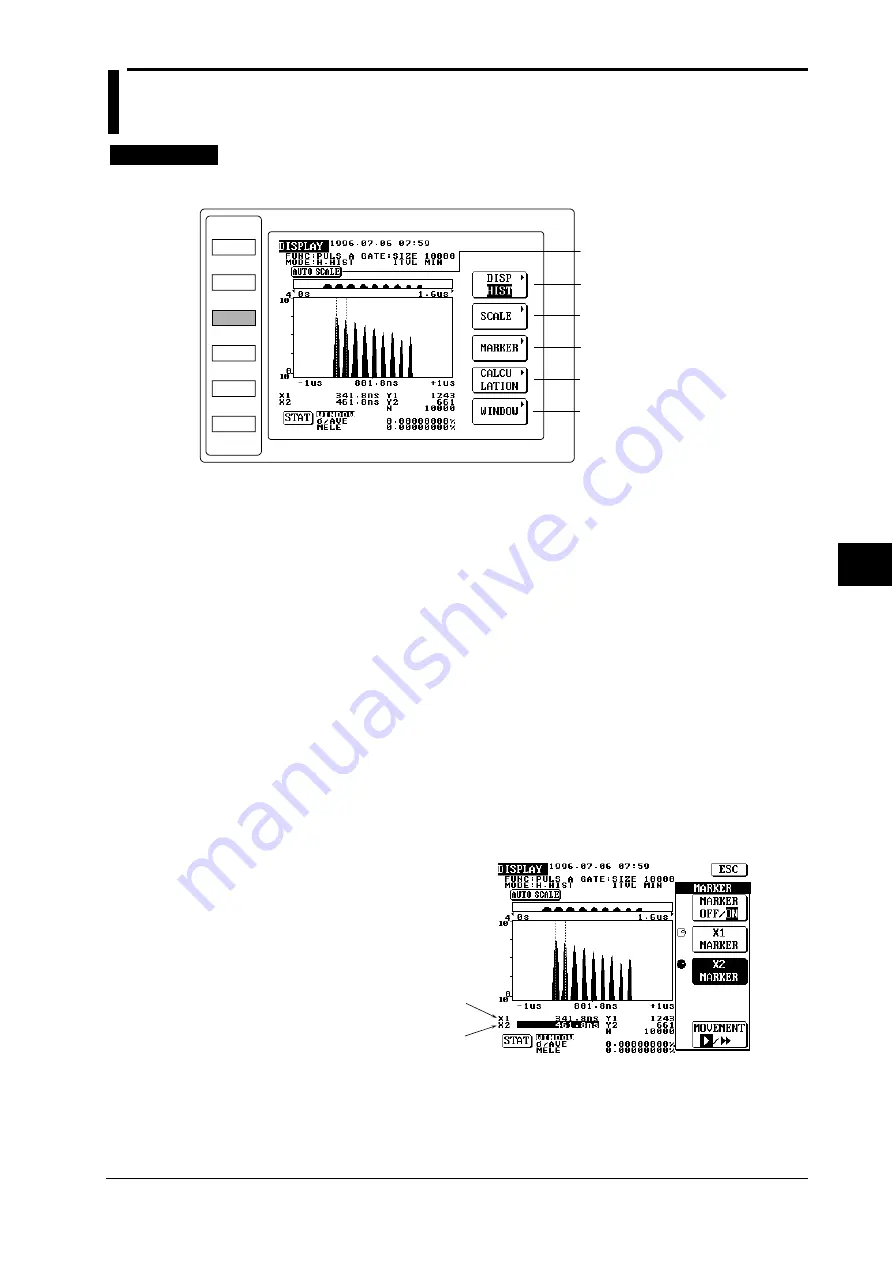
DISPLAY Top Menu
MODE
FUNCTION
DISPLAY
SAMPLE
INPUT
UTILITY
Displays the display format menu.
Displays the X-axis/Y-axis menu.
Displays the marker menu.
Displays the calculation menu.
Performs auto scaling.
Displays the multi-window menu.
(displayed for hardware histogram mode only)
1.
Press the DISPLAY key to display the DISPLAY top menu.
Selecting the histogram display function
2.
Select the histogram display function as described in 7.1.
Performing auto scaling
3.
Perform auto scaling as described in 7.1.
Preparation before using the multi-window function
4.
Press the MARKER touch key of the DISPLAY top menu to display the marker menu.
5.
Press the MARKER touch key of the marker menu to highlight ON.
6.
Some histograms will be displayed on the screen. Move the X1 marker to the highest
frequency position of the left most histogram by turning the rotary knob, and read and record
the X-axis coordinate of the X1 marker.
7.
Next, move the X2 marker to the highest frequency position of the second histogram from
the left by turning the rotary knob, read the X-axis coordinate of the X2 marker, then read
and record the displacement from the X1 marker.
8.
Press the ESC touch key to return to the DISPLAY top menu.
X-axis coordinate of the X1 marker
X-axis coordinate of the X2 marker
DISPLAY Top Menu


