22
W&T
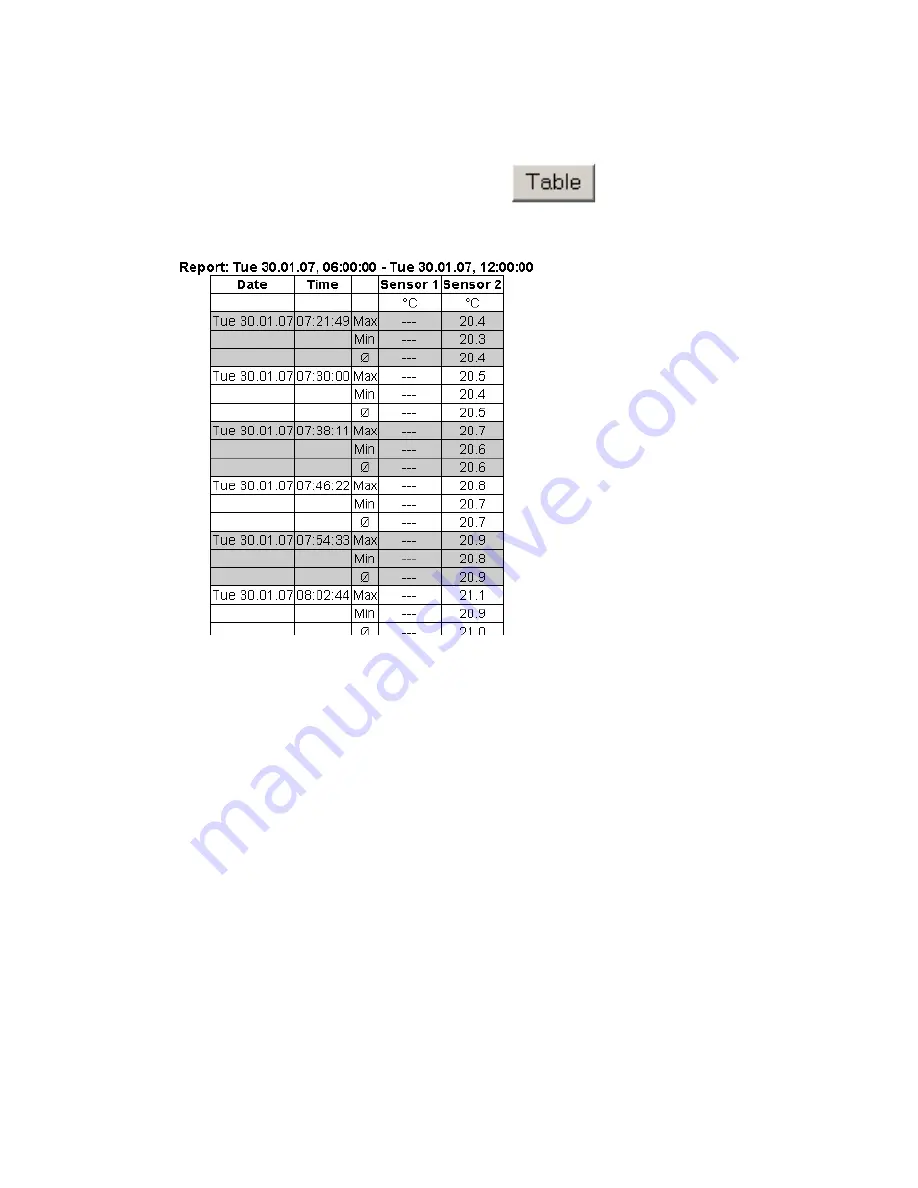
2.3 Table
This function is used to show the currently represented values
in table format. As soon as not all stored values can be
displayed, the following values are shown in the table for each
sensor:
Max:
The maximum value in the displayed interval
Min:
The minimum value in the displayed interval
Ø:
The average value of the displayed interval
Содержание Web-Thermo-Hygrobarograph PoE 57612
Страница 20: ...20 W T Design and positioning of the graph is configurable 2 2 Config menu...
Страница 31: ...31 W T Subject to errors and changes 3 5 1 Basic Settings 3 5 Configuration of the graphics settings...
Страница 37: ...37 W T Subject to errors and changes...
Страница 42: ...42 W T 3 8 2 Alarm X Here you configure the desired alarm conditions...
Страница 90: ...90 W T 7 6 Declaration of Conformity...


