


25
The electronics inside the WDSS translate the pressure reading to an altitude based
on the approximation that, for relatively small ranges of altitudes, the pressure varies
in a linear way with altitude. (A pressure
vs
. altitude graph is nearly linear, with a
negative slope, over a relatively narrow range of altitudes.) Since the WDSS
altimeter always zeros the altitude at the start of data collection, the only calibration
factor is the ratio of altitude to pressure (slope of the altitude-pressure graph).
The altimeter will also have a very small response to acceleration because of inertial
forces acting on the pressure sensor's diaphragm. If you accelerate the WDSS
vigorously, you may notice a very small apparent change in altitude. Similarly, the
sensitive pressure sensor may respond to air currents. This effect is also very small.
Calibration of the WDSS altimeter is almost never necessary, but if you choose to do
it, it can be handled in one of two ways:
1. Manually change the slope of the calibration equation:
a.
Click on WDSS icon on the toolbar.
b.
Click on the Configure button for the altimeter in the WDSS Setup
dialog and a pull-down menu is displayed.
c.
Click on Calibrate.
d.
Click on the Equation tab of the Sensor Settings Dialog.
e.
Change the slope of the calibration equation.
or
2. Do a normal two-point calibration, moving the WDSS to two different known
altitudes. Since you will probably need to change the altitude more than
Bluetooth communications will allow with your computer staying in one spot,
this will probably involve moving your computer up and down also. It would
work best with a laptop computer.
26
Experiments Using the Wireless
Dynamics Sensor System
Experiments Using Just the Force Sensor
Collision Experiments
Studying forces during collisions of a dynamics cart with a rigid object yields
information about how forces vary during collisions. You can vary the bumper or the
material between the rigid object and the force sensor bumper. It is a great way to
show students that making the collision take more time decreases the peak force.
This is an important concept, since it explains a lot of things about automobile safety
(air bags, crumple zones, etc.).
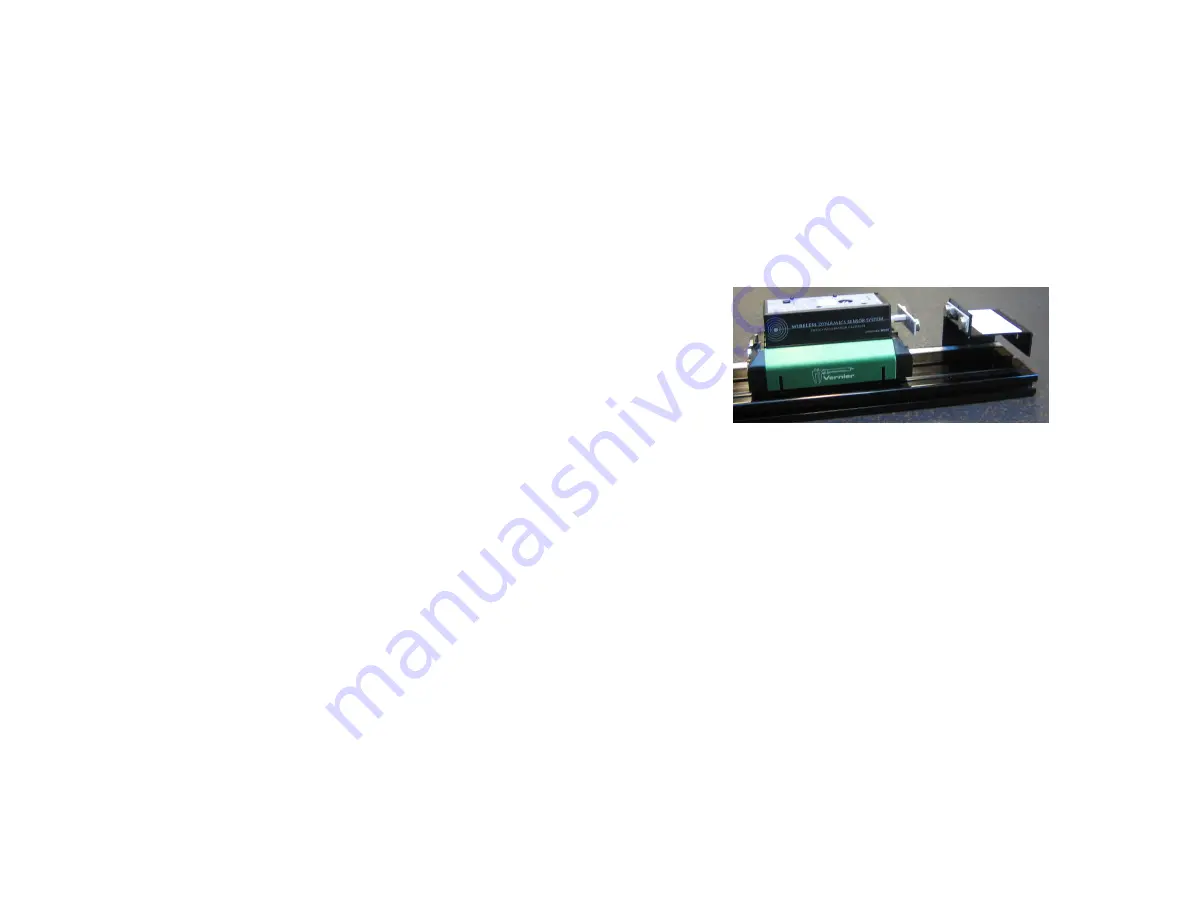
Impulse-momentum setup using Vernier Dynamics Track Adapter (DTA-DFS)
Mount the WDSS on the dynamics cart and have the cart collide with a stationary
object at the end of the track. Another option is to screw a vertical rod through the
hole in the WDSS and mount the WDSS stationary at the end of the track and have
the moving cart collide with it. Collide a dynamics cart into the stationary collision
bumper on the WDSS.
A classic experiment is to compare the integral of the force
vs
. time graph with the
change in momentum of the cart undergoing this type of collision. If you get a graph
of force
vs.
time in Logger
Pro
, you can use the Integral tool to do the integration.
For studying the momentum change, you need to get the speed before and after the
collision. There are three ways to make these measurements:
1. Use Logger
Pro
, a WDSS,
a LabPro
,
and a Motion Detector to make graphs of
the motion and the force at the same time. Examine the velocity
vs.
time graph to
determine the speeds before and after the collision.
2. Use Logger
Pro
, a WDSS,
and a Go!Motion to make graphs of the motion and
the force at the same time. Examine the velocity
vs
. time graph to determine the
speeds before and after the collision.
3. Use a photogate connected to a LabPro, a WDSS, and Logger
Pro
software to


