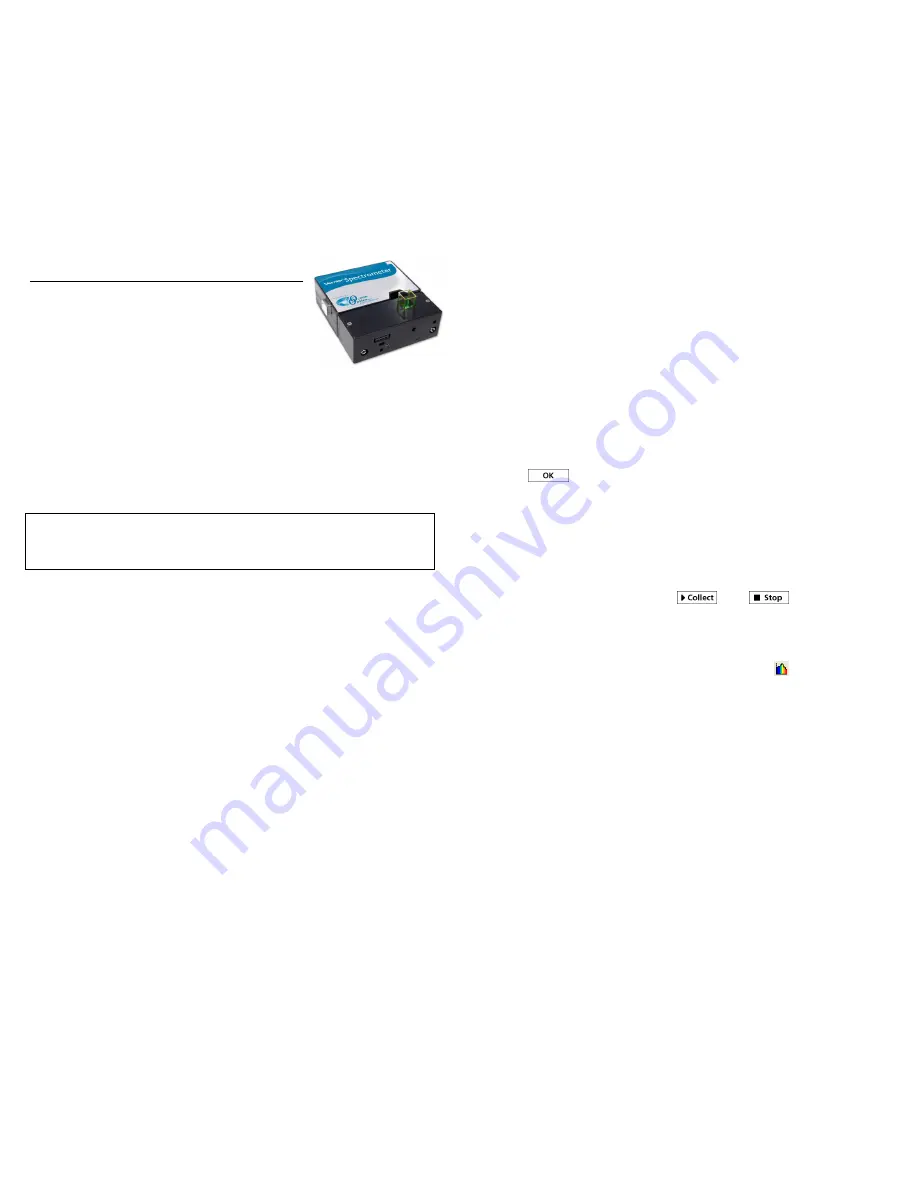
Vernier Spectrometer
(Order Code: V-SPEC)
The Vernier Spectrometer is a portable visible light
spectrometer.
What is Included with the Vernier Spectrometer?
Spectrometer (with light source/cuvette holder attached)
One package of 15 plastic cuvettes and lids
USB cable
Software Requirements
Logger
Pro
®
3 (version 3.8.5 or newer) software is required if you are using a
computer. LabQuest App version 2.0, or newer, is required if you are using
LabQuest
®
2. LabQuest App 1.1, or newer, is required if you are using the original
LabQuest. Visit the downloads section of www.vernier.com to update your software.
NOTE:
Vernier products are designed for educational use. Our products are not
designed nor are they recommended for any industrial, medical, or commercial
process such as life support, patient diagnosis, control of a manufacturing process, or
industrial testing of any kind.
Safety
When this instrument is in data-collection mode labeled “Intensity”, the light
source will be blocked or turned off. Continue to use proper safety precautions.
Do not remove or modify any of the installed safety components of this device.
Doing so will create an unsafe operating condition and will void the product
warranty.
No user-serviceable parts are in this device. Do not attempt to open or modify this
device. Contact Vernier for all repairs and service including lamp replacement.
Handle the device with care. This instrument can be damaged if it is dropped.
Do not use this instrument if it is damaged in any way. Contact Vernier Technical
Support for troubleshooting and technical assistance.
Do not use this instrument for clinical or diagnostic procedures.
Use the Vernier Spectrometer with a Computer
(For LabQuest instructions, see page 5)
Getting Started
1. Ensure Logger
Pro
software (version 3.8.5 or newer) is installed on your
computer before using the Vernier Spectrometer.
2. Connect the Spectrometer to a powered USB port on the computer or a powered
USB hub.
Note:
The first time you connect a spectrometer, your computer may
ask you a few questions.
Do not go online for device drivers
. The device drivers
were installed when you installed Logger
Pro
3.
3. Start Logger
Pro
software on your computer.
2
Select the Type of Data (or Units) You Want to Measure
The default data type is absorbance. If you want to measure the absorbance of a
solution, proceed directly to the Calibrate section below.
If you want to measure %T or intensity, do the following:
1. Choose Change Units
►
Spectrometer from the Experiment menu.
2. Select the unit or data type you wish to measure.
Calibrate (Not Required if Measuring Intensity)
1. To calibrate the Spectrometer, choose Calibrate
►
Spectrometer from the
Experiment menu.
Note
: For best results, allow the Spectrometer to warm up for a
minimum of five minutes.
2. Fill a cuvette about ¾ full with distilled water (or the solvent being used in the
experiment) to serve as the blank. After the Spectrometer has warmed up, place
the blank cuvette in the Spectrometer. Align the cuvette so the clear side of the
cuvette is facing the light source.
3. Follow the instructions in the dialog box to complete the calibration, and then
click
.
Collect Data with a Computer
There are three general types of data collection that measure absorbance or
transmittance—absorbance (or %T)
vs.
wavelength, which produces a spectrum,
absorbance (or %T)
vs
. concentration for Beer’s law experiments, and absorbance
(or %T)
vs.
time for kinetics experiments.
Measurement
vs
. Wavelength (Generate a Spectrum)
1. Fill a cuvette about ¾ full of a sample of the solution to be tested. Place the
sample in the Spectrometer and click
. Click
to end data
collection.
2. To store the spectrum data, choose Store Latest Run from the Experiment menu.
Measurement
vs
. Concentration (Beer’s law Studies)
1. Generate a spectrum as described above.
2. Click the Configure Spectrometer Data Collection button,
.
There are three regions in this box:
Collection Mode
The three options for data collection are offered. If the
measurement (Absorbance in this example)
vs
. Time or
vs
. Concentration is
selected, a wavelength or wavelengths will need to be chosen.
Graph
The graph displays a full-spectrum analysis of the sample in the
cuvette holder. By default, the wavelength with the maximum measured value
will be selected. You may wish to select a different wavelength. See Step 3 for
details.
List of wavelength options
This column lists all the available wavelengths. It
becomes active when either the Concentration or Time mode is selected.
3. Select Absorbance (or %T)
vs
. Concentration as the data-collection mode. The
wavelength with the maximum value from the spectrum (
λ
max) will be
automatically selected. There are three options when choosing a wavelength (or
wavelengths) for subsequent measurements.
Option 1
The default option is to use a single 10 nm band. This measures the
average absorbance from ~5 nm on either side of the chosen wavelength. You


