7
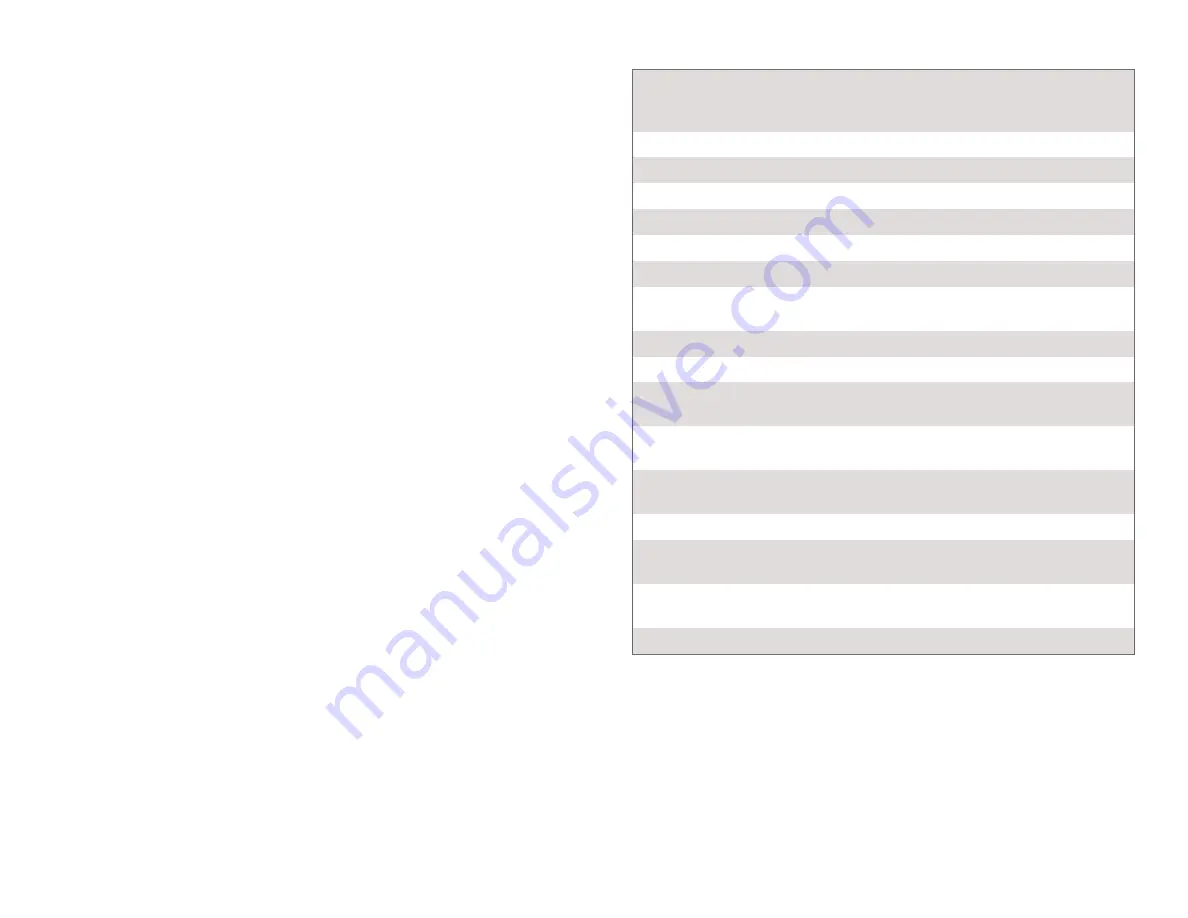
Specifications
Detection modes
Absorbance, % Transmittance, Fluorescence,
Raw Lamp Output, and Intensity (fiber
required)
Dimensions
18.5 cm × 17 cm × 7 cm
Lamp power supply
AC adapter (included)
Power consumption
3 A start-up, 500 mA continuous
Bluetooth power supply
USB (USB adapter included)
Absorbance light source
Deuterium (UV) and Incandescent (VIS)
Detector
Linear CCD
Emission light source
Exchangeable LED included (375 nm,
450 nm, 525 nm)
Wavelength range
220 nm–850 nm
Wavelength reporting interval
~1 nm
Optical resolution
3.0 nm (as determined with 486 nm
hydrogen emission spectral line FWHM)
Wavelength accuracy
± 2.0 nm (as determined with holmium
oxide NIST standard)
Absorbance photometric accuracy ± 5.0% (as determined with potassium
dichromate NIST standards)
Typical scan time
~2 s
Sample format
10 mm × 10 mm cuvette (UV fluorescence
cuvette included)
Fluorescence emission detection
limit
1 mg/L quinine sulfate dihydrate in 0.1 M
H
2
SO
4
Beam height (z dimension)
8.5 mm
Safety
l
Always wear UV blocking safety glasses or goggles when using this device.
The light source emits ultraviolet radiation and can cause eye damage.
l
When this instrument is in data-collection mode labeled Intensity, the light
source will be blocked or turned off. Continue to use proper safety precautions.
l
This instrument contains an internal high-voltage power source. Position the
instrument where the ON/OFF switch can be easily reached. Do not move the
instrument when it is running. Do not attempt to open or remove the case at
any time.
If the spectrum maxes out (flat and wide peaks at a value of 1), increase the
distance between the light source and the tip of the optical fiber cable or reduce
the sample time (see Change the Settings in Logger
Pro
).
To increase the sample time, or if data collection is unusually slow, choose Set Up
Sensors ► Spectrophotometer: 1 from the Experiment menu. Set the Sample Time
(begin with 75 ms, with subsequent reductions by 20 ms) to a suitable value and
decrease the Samples to Average to 1.
Use the Stored Emissions Files in Logger
Pro
Logger
Pro
contains a folder of emissions graphs from selected discharge tubes,
including: argon, helium, hydrogen, mercury, oxygen, sodium, and xenon. You
can display and analyze these graphs without a spectrometer connected to your
computer. Follow these steps to view one of these graphs.
1. Choose Open from the File menu.
2. Open the Sample Data folder.
3. Inside the Sample Data folder, open the Physics folder.
4. Inside the Physics folder, open the Gas Discharge Spectra. Open the desired
file.
You can use the mercury emissions graph to test fluorescent lighting for the
presence of mercury.
Change the Settings in Logger
Pro
The Spectrophotometer dialog box lists all the settings for the device. To display
this box choose Set Up Sensors ► Spectrophotometer from the Experiment menu.
For most experiments, the default settings work well.
There are five parameters listed in the dialog box.
l
Sample Time: This is similar to the shutter speed of a camera. Logger
Pro
automatically selects the proper sample time during calibration.
Note:
For
emission studies, you may need to change the sample time manually.
l
Wavelength Smoothing: This is the number of adjacent readings on either side
of a given value that is used to calculate an average value.
Note:
Be careful
adjusting this parameter as it may shift your wavelength values slightly.
l
Samples to Average: This is the number of readings taken at a given
wavelength to calculate an average reading.
l
Wavelength Range: The range is determined by the type of Spectrophotometer
in use.
l
LED Intensity: This allows you to change the intensity of the excitation LED.
By clicking on the picture of the Spectrophotometer in this dialog box, you will
gain access to four options: calibrate, configure data collection, go to the support
website, and units of measure. Click on an item to select it.
Videos
View videos related to this product at


