24
USING THE UNIT
TEMPERATURES AND SENSORS
Viewing temperature data
1. Select
Settings
>
Temperatures and sensors.
2. Select
OK
.
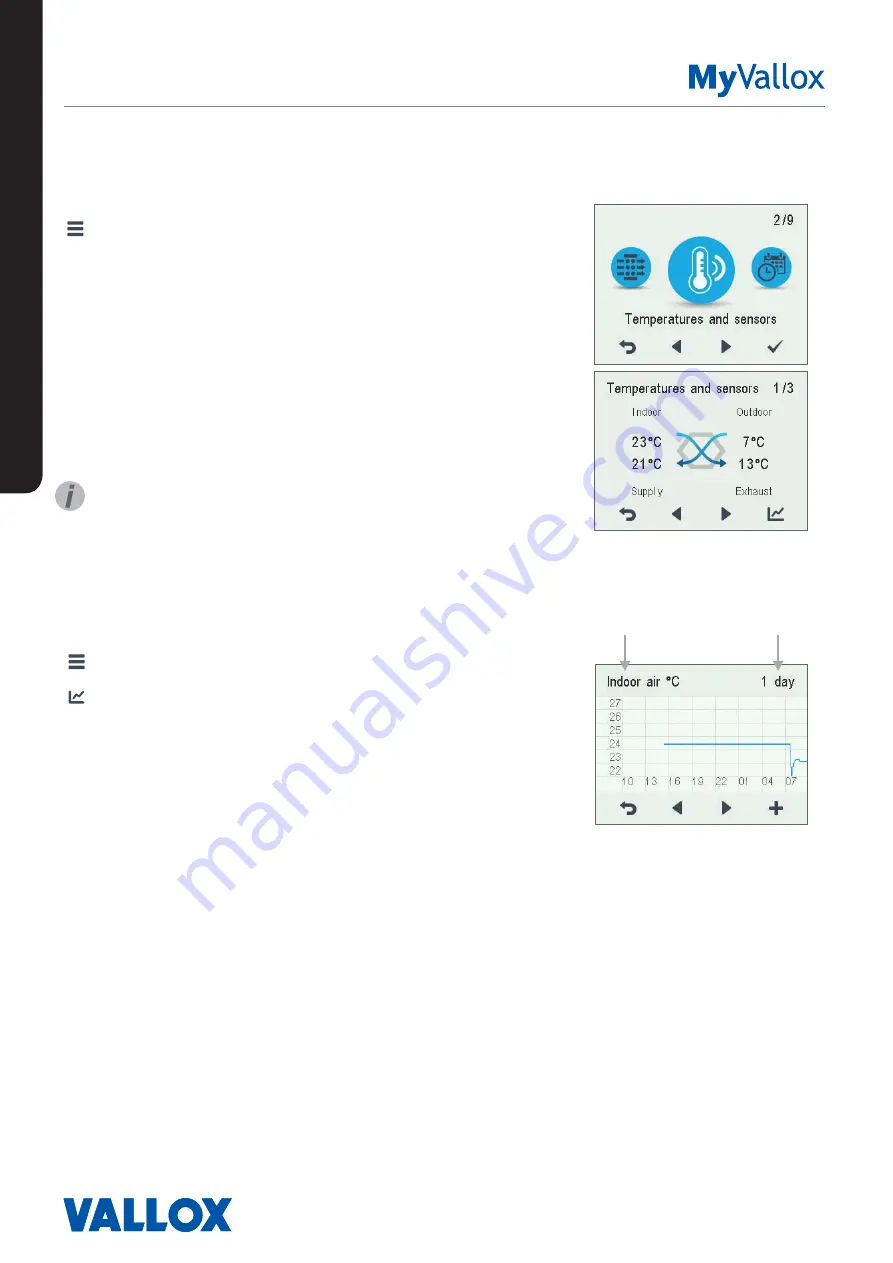
The summary display of temperatures and sensors shows
the following information:
• Indoor
— Indicates the temperature of the air flowing into
the unit to be removed from the premises.
• Outdoor
— Indicates the temperature of the air flowing
into the unit from outside.
• Supply
— Indicates the temperature of the air flowing
into the premises from the unit.
• Exhaust
— Indicates the temperature of the exhaust air
flowing outdoors from the unit.
TIP
The temperature and sensor data can also be viewed by
pressing the temperature button on the profile display.
Viewing temperature statistics
1. Select
Settings
>
Temperatures and sensors.
2. Select
OK
.
3. Select
Statistics
.
4. A graph appears on the display showing the indoor air
temperature over the past 24 hours.
5. Use
the
Plus
and
Minus
buttons to alternate between
weekly and daily statistics.
6. Use
the
arrow
buttons to view outdoor air, supply air,
and exhaust air temperature statistics.
7. On each display, use the
Plus
and
Minus
buttons to
alternate between weekly and daily statistics.
8. To exit the menu, press the
Back
button.
Indoor air temperature graph for the
past 24 hours. The outside and supply
air values are shown on a similar
display. You can view the graph for a
week or for a single day.
Indoor air
Outdoor air
Supply air
Exhaust air
1 day
1 week


