TideMaster - Operating Manual: MANUAL-1094978189-1 | issue: 1.1
© 2021
– Valeport Ltd
Page | 38
8.2 Data Download
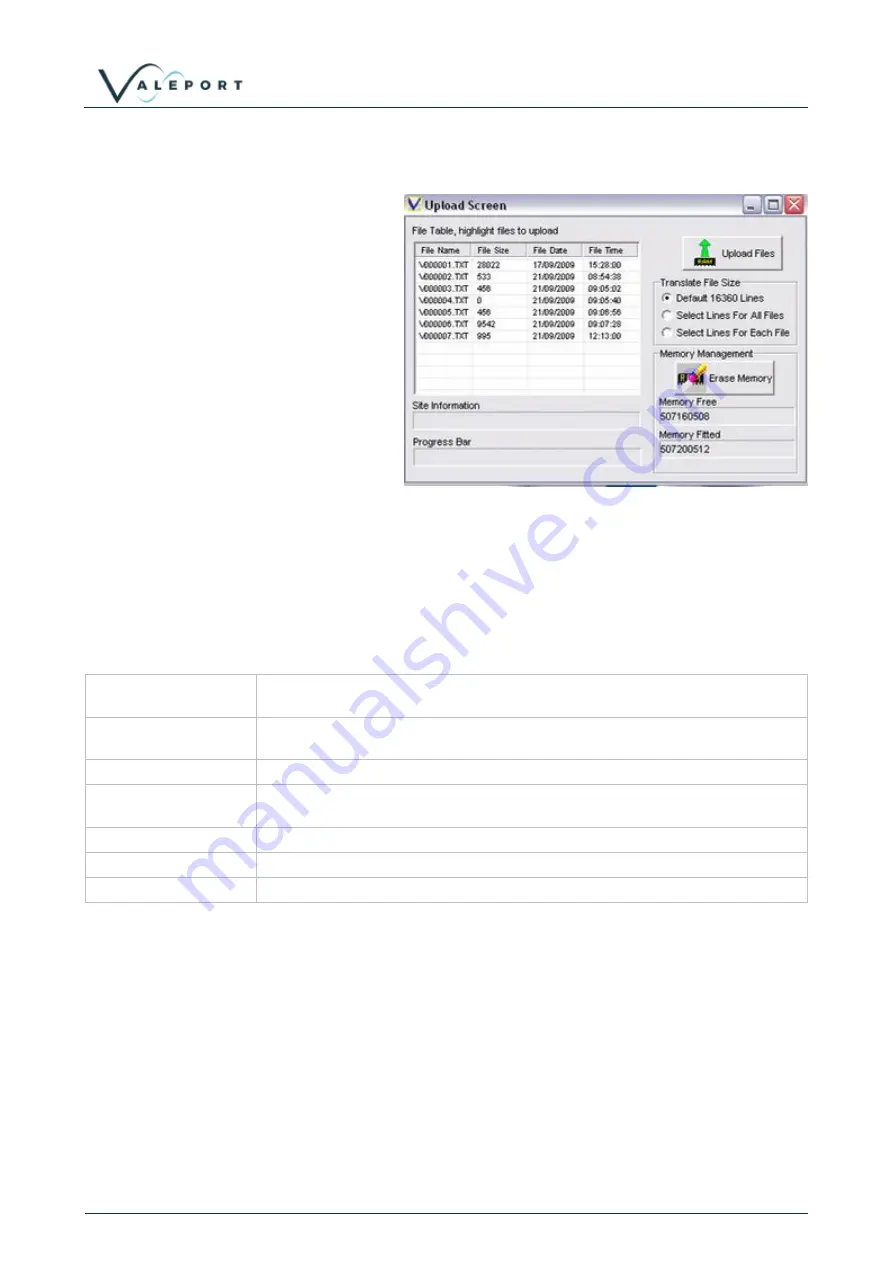
To Upload data from the instrument
memory, it is first necessary to establish
communications as described in Section
6.2. From the “Communications
Established” window, click the “Upload
Screen” button.
This screen lists all the data files held in
the instrument’s memory. It also shows
the size of the file, and the date and time
at which it was created. Note that a new
file is created each time the instrument is
put into “Run” mode,
Choose the files you wish to upload by
highlighting them, using the standard
Windows Shift and Ctrl buttons to select
multiple files. Then click the “Upload Files”
button
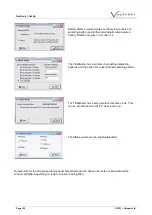
The text files may be opened in a standard spreadsheet package for further analysis or manipulation. A
confirmation window will appear to show that the process is complete.
8.3 Data Display - TideMaster Express
Simple
A numerical display (large characters) of the latest reading from any single
chosen parameter.
Scroll
A tabular display listing the current and historical data from any single chosen
parameter.
Graph
A time series graphical display of data from multiple parameters.
Surge Graph
A graphical representation of the difference between predicted and observed
tides. (Only available if predicted files are loaded)
Last Data
A tabular display showing the latest reading from multiple parameters.
Wind Rose
A graphical representation of the current wind speed and direction.
Predicted
A graphical representation of predicted tide data
The data display functions of TideMaster Expre
ss have been designed around the concept of “create your
own display”. There are six basic display window types; each may be selected from the “Display Type”
menu.


