30
Controller Sections
Icon Description
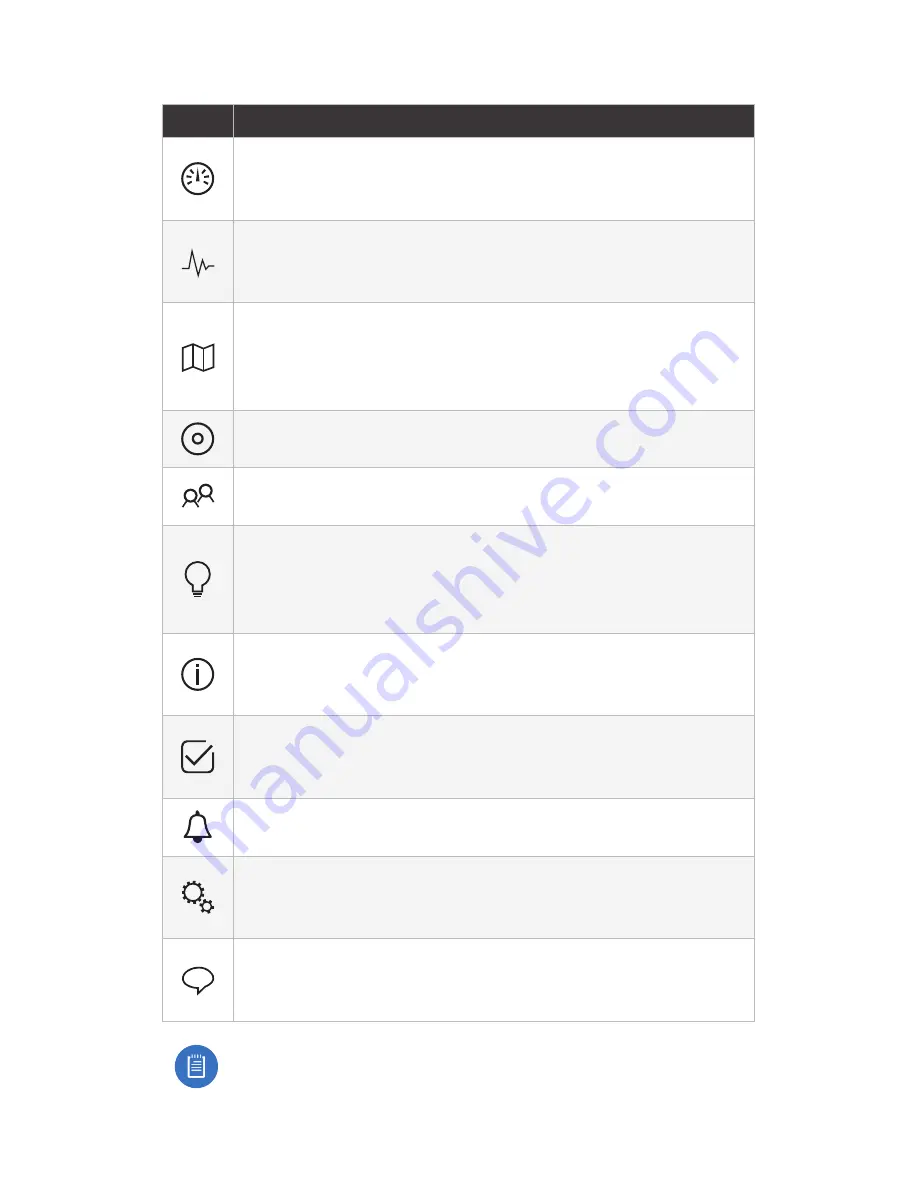
The Dashboard screen provides a visual overview
of your network’s status, including latency and
throughput information for each client and device.
The Statistics screen provides a visual representation
of the clients and network traffic on your managed
UniFi SDN network.
The Map section allows you to create maps (either
upload custom images of your location(s) or use
Google Maps
™
) for a visual representation of your
SDN network and also view your system topology.
The Devices screen displays a list of UniFi devices
managed by your SDN controller.
The Clients screen displays a list of clients connected
to UniFi devices managed by your SDN controller.
The Insights screen lists detailed information about
local and surrounding wireless networks, client and
device statistics, security and connection detail, and
other controller access information.
The Release Notes window provides information and
details on the incorporated changes and/or updates
to the latest UniFi SDN controller software.
The Events screen provides a list of all events and
activity taking place on your network, including
errors and warnings.
The Alerts window provides a list of alerts and events
occurring on your network.
The Settings screen provides detailed information
about your UniFi SDN controller and allows you to
add/change/update the site configuration.
The Live Chat Support screen provides access to a
UniFi professional support representative available
via live chat 24/7.
Note:
For further details on any section, refer to
the complete UniFi User Guide, available online at
www.ubnt.com/download/unifi


