


© Copyright 2017 TRENDnet. All Rights Reserved.
TRENDnet User’s Guide
TEW-WLC100P
42
Monitoring access points and clients
Viewing the controller dashboard
Monitor > Dashboard
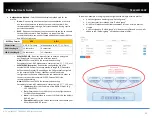
The dashboard displays an overview of the most recent activity for APs, clients, and data
usage over time.
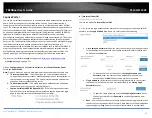
1. Log into your controller management page (see “
Access you wireless controller
” on page 10).
2. Click on Monitor and click Dashboard.
Period of Time for Display – You can select the most recent time interval time
interval of data to display on the entire dashboard: most recent 5 minutes, 1
hour, or 1 day for monitoring. You can also click Stop Monitoring to stop the
controller from collecting or monitoring any new data.
A.
Clients (Total) – This section will display a list top 5 wireless profile SSIDs
with highest amount of data usage/activity. When hovering over with
your cursor, the SSID name and total number of data
transmitted/received will be displayed.
B.
Current Usage (Top Access Points) – This section will display the top 5
access points with the highest amount of data usage/activity. When
hovering over with your cursor, the AP MAC address and total number
of packets transmitted/received will be displayed.
C.
Quick Look – This section will display the AP with the most recent
activity, client with the most recent activity, and client with the highest
amount of data usage.
D.
Recent Activities – This section displays a chart of the most recent
activity. The Clients (Total) chart displays the total number of clients
over the most recent time interval. The Traffic (Mbytes) chart displays
the total number of packets transmitted on all APs over the most recent
time interval.
Содержание TEW-WLC100P
Страница 1: ...TRENDnet User s Guide Cover Page ...
Страница 57: ......