28
TRBOnet Swift A100 – User Manual
For each pin, expand the
Pin value
menu and select the active level exactly as
specified in the A100 configuration (see section
).
After you apply the changes, launch the TRBOnet Watch console and click
Live Monitor
in the left pane. You can see the states of the connected A100 pins on
the
Diagnostics
tab and on the
Physical GPIO Pins
tab.
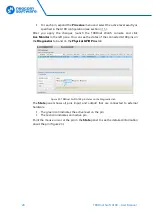
Figure 23: TRBOnet Swift A100 pin states on the Diagnostics tab
The
State
panel shows all pins (input and output) that are connected to external
hardware.
The green icon indicates the active level on the pin.
The red icon indicates an inactive pin.
Point the mouse cursor at the pin in the
State
panel to see the detailed information
about the pin (Figure 23).

