


Touch Screen Controller
Owner's Manual
74
-EN
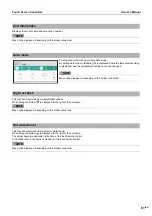
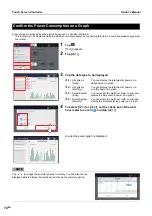
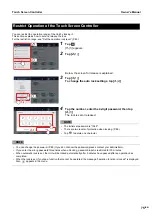
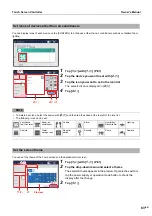
Pulse values are graphed and the electric power can be visually confirmed.
* This function can be displayed when the electric power is measured by connecting this Unit to a pulse transmission type watt
hour meter.
●
NOTE
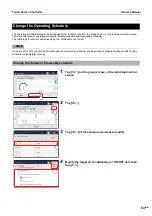
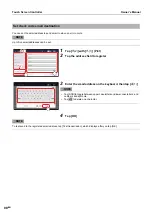
Confirm the Power Consumption on a Graph
1
Tap
[
1
-(1)] appears.
2
Tap [
2
-(1)
]
3
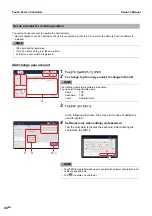
Tap the data type to be displayed
4
To select [
3
-(3)
] or [
3
-(4)
], set the check box of the watt
hour meter to sum to
and tap [
4
-(1)
]
An electric power graph is displayed.
2
-(1)
2
-(1)
1
-(1)
1
-(1)
3
-(1)
3
-(1)
3
-(2)
3
-(2)
3
-(3)
3
-(3)
3
-(4)
3
-(4)
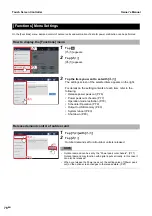
3
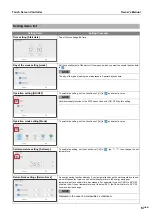
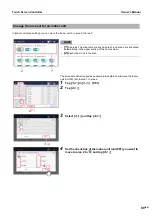
-(1)
All systems
(Daily):
You can display the total electric power on a
daily basis on a graph.
3
-(2)
All systems
(Monthly):
You can display the total electric power on a
monthly basis on a graph.
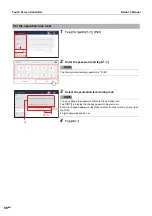
3
-(3)
Select System
(Daily):
You can select the watt hour meter to sum and
display the daily electric power on a graph.
3
-(4)
Select System
(Monthly):
You can select the watt hour meter to sum and
display the monthly electric power on a graph.
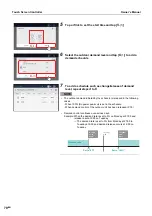
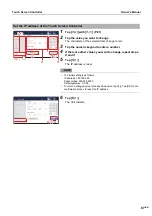
4
-(1)
4
-(1)
Tap
to change the summary period to display. You can also tap the
displayed date to display the calendar and change the summary period.


