


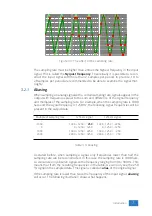


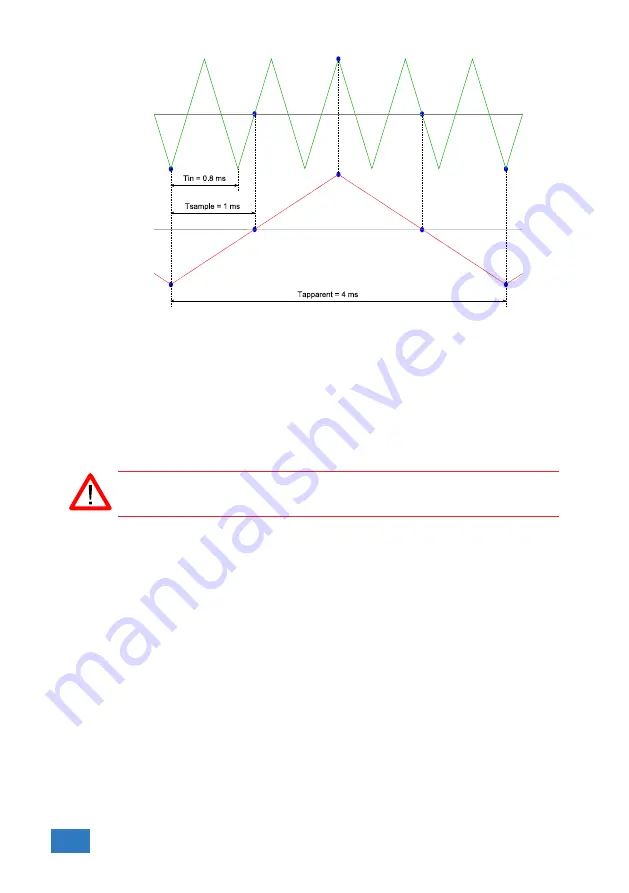
Figure 3.4: Aliasing
In figure
, the green input signal (top) is a triangular signal with a frequency of
1.25 kHz. The signal is sampled with a rate of 1 kSa/s. The corresponding sam-
pling interval is 1/1000Hz = 1ms. The positions at which the signal is sampled are
depicted with the blue dots. The red dotted signal (bottom) is the result of the re-
construction. The period time of this triangular signal appears to be 4 ms, which
corresponds to an apparent frequency (alias) of 250 Hz (1.25 kHz - 1 kHz).
To avoid aliasing, always start measuring at the highest sampling rate and
lower the sampling rate if required.
3.3
Digitizing
When digitizing the samples, the voltage at each sample time is converted to a
number. This is done by comparing the voltage with a number of levels. The re-
sulting number is the number corresponding to the level that is closest to the
voltage. The number of levels is determined by the resolution, according to the
following relation:
LevelCount
= 2
Resolution
.
The higher the
resolution
, the more levels are available and the more accurate
the input signal can be reconstructed. In figure
, the same signal is digitized,
using two different amounts of levels: 16 (4-bit) and 64 (6-bit).
8
Chapter 3
Содержание Handyscope HS4
Страница 1: ...Handyscope HS4 User manual TiePie engineering...
Страница 6: ......
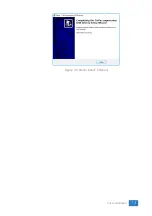
Страница 17: ...Figure 4 3 Driver install Finished Driver installation 13...
Страница 18: ...14 Chapter 4...
Страница 20: ...16 Chapter 5...
Страница 22: ...18 Chapter 6...
Страница 26: ...22 Chapter 7...
Страница 30: ...26 Chapter 8...
Страница 32: ...TiePie engineering Handyscope HS4 instrument manual revision 2 27 February 2020...


