3
OMNICxi Software Operation
Overview of the Workspace
Thermo Scientific
DXRxi User Guide
73
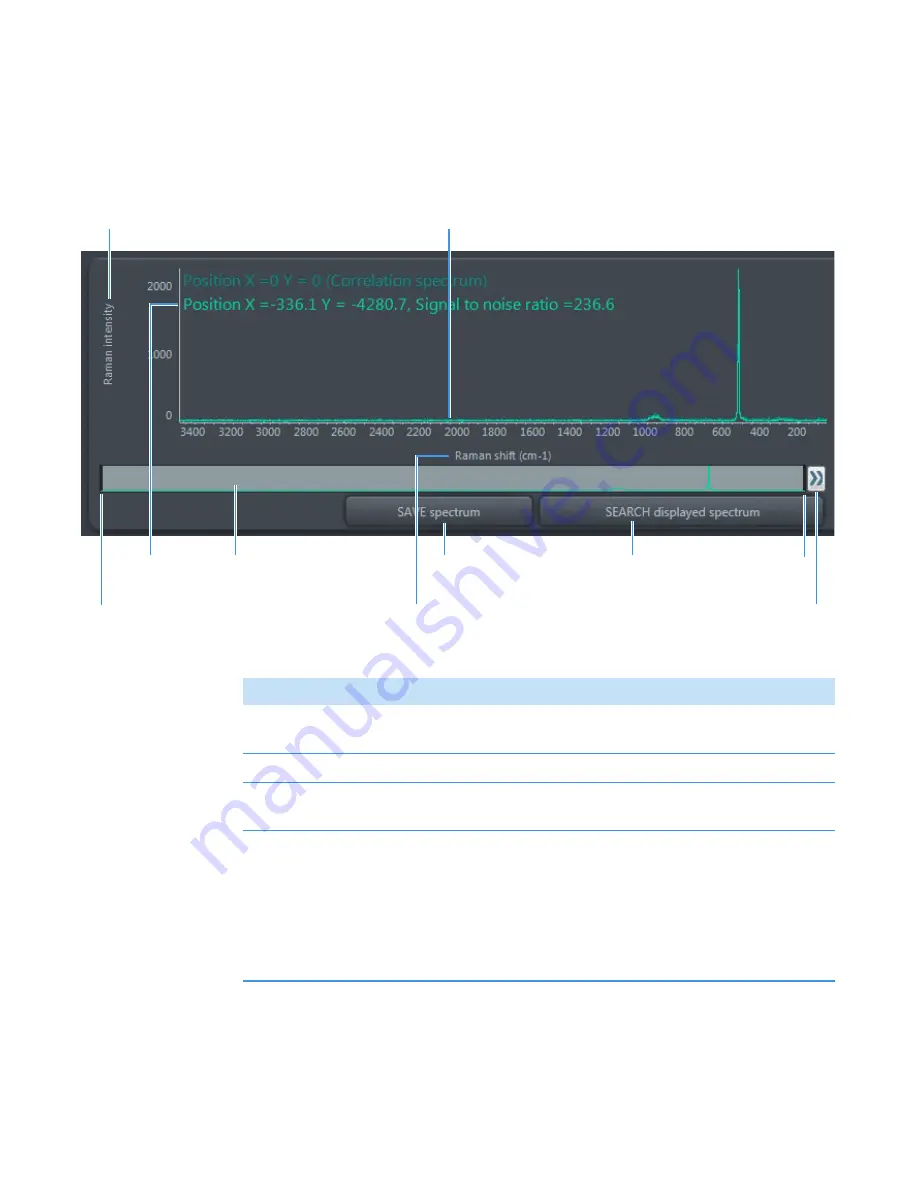
To learn about a feature in the spectral pane, click its name in the image below.
Figure 64.
Spectral pane features and controls
Spectrum at current cursor
location in chemical image
Click to display/hide the view finder
Table 11.
Spectral pane features and controls
Feature
Description
Y-axis data format
The Y-axis of displayed spectra is always Raman intensity
(detector counts)
X-axis data format
Defined by the
option in the Settings box
Spectrum title
Shows the associated spectrum’s location in the acquired chemical
image and the signal-to-noise ratio at that location
View finder
Can be used to:
•
Change
the display limits of spectra displayed in the spectral
pane (drag the vertical limit lines)
•
Display
a different region of spectra displayed in the spectral
pane (click the region)
•
Expand
the X-axis of spectra displayed in the spectral pane to
their limits (double-click between the limit lines)
Содержание DXR xi
Страница 12: ...1 Introducing the DXRxi Raman Imaging System Trademarks 6 DXRxi User Guide Thermo Scientific...
Страница 14: ...2 DXRxi Microscope Operation 8 DXRxi User Guide Thermo Scientific...
Страница 64: ...Safety Information 58 DXRxi User Guide Thermo Scientific Microscope Safety Labels or...
Страница 65: ...Safety Information Thermo Scientific DXRxi User Guide 59...
Страница 66: ...Safety Information 60 DXRxi User Guide Thermo Scientific...
Страница 67: ...Safety Information Thermo Scientific DXRxi User Guide 61...
Страница 68: ...Safety Information 62 DXRxi User Guide Thermo Scientific...
Страница 166: ...3 OMNICxi Software Operation Acquire and Analyze Data 160 DXRxi User Guide Thermo Scientific...


