Texmate, Inc. Tel. (760) 598-9899 • www.texmate.com
Page 8
FL-B101Q-DCA _ FL-B01Q-DCV (d0084)
Setting the Colors (For CHT or CVT Center Bar display options only)
100
212
0
32
SP1 SP2 SP3 SP4
Zero Span
Lo
output
Hi
Apply power
while holding down
SP1, SP2, SP3, SP4
SP2
SP1
SP3
SP4
100
212
0
32
SP1 SP2 SP3 SP4
Zero Span
Lo
output
Hi
Select required
color (i.e. orange)
SP1
100
212
0
32
SP1 SP2 SP3 SP4
Zero Span
Lo
output
Hi
Select required
color (i.e. Green)
SP2
100
212
0
32
SP1 SP2 SP3 SP4
Zero Span
Lo
output
Hi
Select required
color (i.e. Orange)
SP3
100
212
0
32
SP1 SP2 SP3 SP4
Zero Span
Lo
output
Hi
Select required
color (i.e. Red)
SP4
To comply with the latest safety requirements, the tri-color bargraph is designed like a traffic light, to
display either red, orange or green, but only one color at a time. When the bar reaches a selected
color change point, the entire bar will change to the color designated for that zone. This eliminates
any ambiguity as to the signal status, especially just after transitioning to a new zone.
However, if two or more setpoints with differently specified colors are positioned at the same set point
value, the color specified for the set point with the highest identifying number will be displayed. When
set points are set to the same value, the SP4 color overrides the SP3 color, the SP3 color overrides
the SP2 color, and the SP2 color overrides the SP1 color.
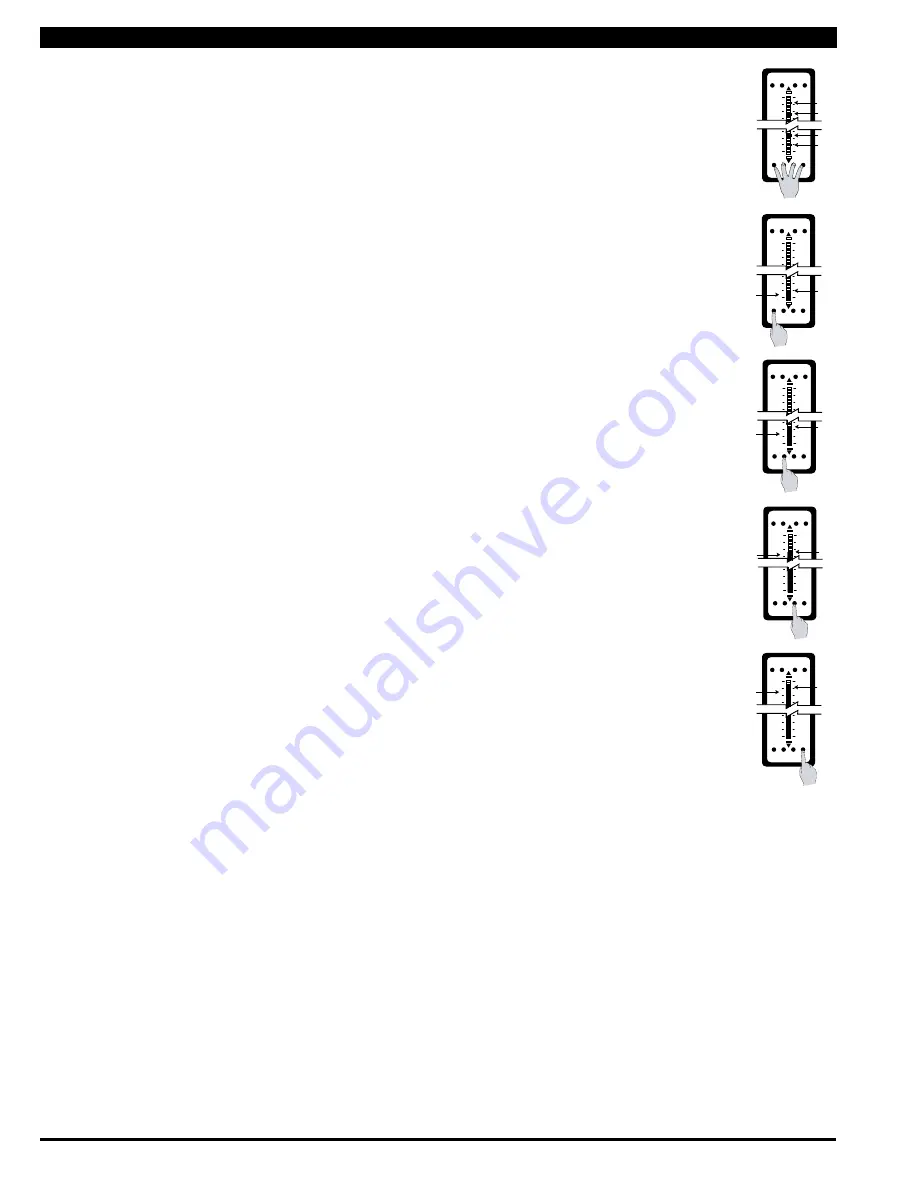
STEP A ENTER COLOR SET MODE
Hold down ALL four setpoint buttons (SP1, SP2, SP3 and SP4) and apply power to the
meter. The meter will light up in the Color Set Mode. Release all the setpoint buttons.
STEP B SELECT COLOR FOR BAR ABOVE SETPOINT 1
Hold down the SP1 button. The color of the bar segments below SP1 will cycle between red,
green and orange. Release the SP1 button when the bar is the required color. Now
Whenever the bar is above the SP1 level it will be this color. When the bar is below the SP1
level it will always be red.
STEP C SELECT COLOR FOR BAR ABOVE SETPOINT 2
Hold down the SP2 button. The color of the bar segments below SP2 will cycle between red,
green and orange. Release the SP2 button when the bar is the required color. Now
whenever the bar is above the SP2 level it will be this color.
STEP D SELECT COLOR FOR BAR ABOVE SETPOINT 3
Hold down the SP3 button. The color of the bar segments below SP3 will cycle between red,
green and orange. Release the SP3 button when the bar is the required color. Now
whenever the bar is above the SP3 level it will be this color.
STEP E SELECT COLOR FOR BAR ABOVE SETPOINT 4
Hold down the SP4 button. The color of the bar segments below SP4 will cycle between red,
green and orange. Release the SP4 button when the bar is the required color. Now
whenever the bar is above the SP4 level it will be this color.
STEP F EXIT COLOR SET MODE
Turn off the power to the meter for 5 seconds and then re apply the power. The bargraph will now work with the programmed colors.


