


5.2.4
Viewing Queue Depth Summary
Use the outstanding queue depth summary to analyze the
utilization of the RamSan’s resources. If the queue depth is below
one, then the RamSan is not being fully utilized. If the queue
depth is above or at one, then you may wish to add additional links
or change other performance parameters to further utilize the
RamSan.
Via Web Interface
To view the outstanding command queue depth statistics via the
web interface:
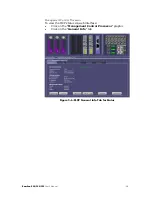
•
Click on one of the “Fibre Channel” graphics or the
“Management Control Processor” graphic.
•
Click on the “Statistics” tab
•
Click the radio button next to “Queue”
The graphing tool provides the option to view the read and write
command queue depth, as well as an average of each of these
statistics. To decode the colors on the graphical display, see the
legend below the check boxes.
Figure 5-19: Queue Depth Statistics via Web Interface
RamSan-300/320/325
User’s Manual
- 61 -
Содержание 320
Страница 1: ...TEXAS MEMORY SYSTEMS INC RamSan 300 320 325 User s Manual Version 2 1 ...
Страница 12: ...Figure 2 1 RamSan 320 325 Layout RamSan 300 320 325 User s Manual 8 ...
Страница 110: ...Figure B 3 Power Supply Module Figure A 5 Memory Blade RamSan 300 320 325 User s Manual 106 ...
Страница 111: ...Figure A 6 120 Gigabyte Replacement Hard Drive RamSan 300 320 325 User s Manual 107 ...