


TI-83 Plus CellSheet™ Application
Page 87
3. Enter the range for the data (
E2:E5
) at the
Series
prompt.
4. Select
Percent
by moving the cursor to the option and
pressing
¯
.
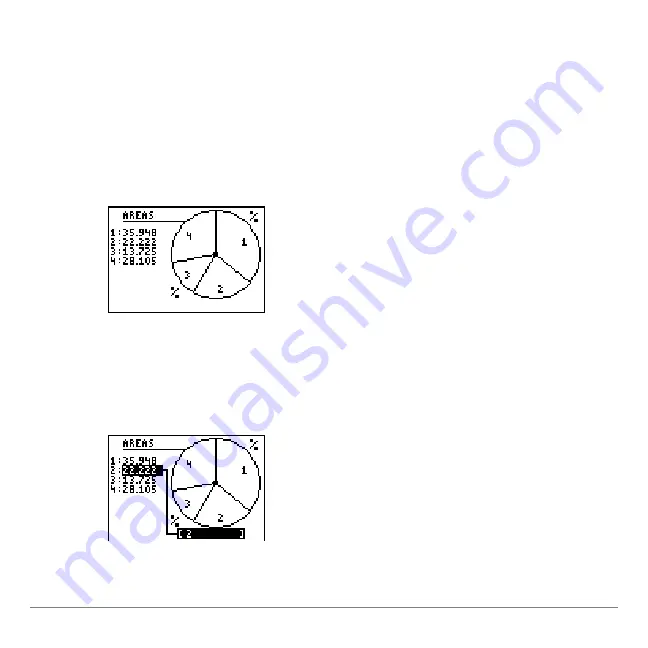
5. Enter the title
AREAS
at the
Title
prompt.
6. Press
¯
again to display the chart.
7. Press
U
and use the arrow keys to display the category
labels.
8. Press
\
two times to exit the pie chart.