5 Test Results
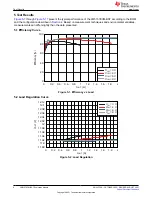
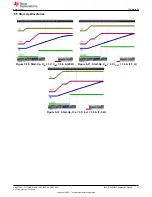
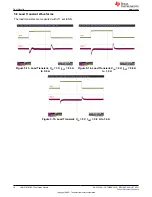
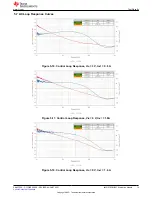
through
present the typical performance of the LM5157EVM-BST according to the BOM
and the configuration described in
. Based on measurement techniques and environmental variables,
measurements can differ slightly than the data presented.
5.1 Efficiency Curve
I
OUT
(A)
E
ffi
ciency
(%)
0
0.2
0.4
0.6
0.8
1
1.2
1.4
1.6
1.8
2
0
20
40
60
80
100
V
IN
= 3 V
V
IN
= 4 V
V
IN
= 6 V
V
IN
= 9 V
Figure 5-1. Efficiency vs Load
5.2 Load Regulation Curve
I
OUT
(A)
V
OUT
(V
)
0
0.2
0.4
0.6
0.8
1
1.2
1.4
1.6
1.8
2
11.88
11.9
11.92
11.94
11.96
11.98
12
12.02
12.04
12.06
12.08
12.1
12.12
V
IN
= 3 V
V
IN
= 4 V
V
IN
= 6 V
V
IN
= 9 V
Figure 5-2. Load Regulation
Test Results
8
LM5157EVM-BST Evaluation Module
SNVU739A – OCTOBER 2020 – REVISED AUGUST 2021
Copyright © 2021 Texas Instruments Incorporated


