background image

-5-


Figure-21:

 It shows the frequency values of each phase. The figure-22 is displayed when you press the 

Down button.


Figure-22:


It shows the minimum frequency values of each phase. The figure-23 is displayed when you 

press the Down button.


Figure-23:


It shows the maximum frequency values of each phase. The figure-24 is displayed when you 

press the Down button.


Figure-24:


It shows the mean frequency values of each phase. The 

Home Screen

 is displayed when you 

press the Down button.

L1

L2

L3

  F

Out1

Hz

Hz

Hz

Figure-21

  F

Out1

Hz

Hz

Hz

Figure-22

  F

Out1

Hz

Hz

Hz

Figure-23

  F

Out1

Hz

Hz

Hz

Figure-24


Figure-16:

 It shows the apparent power values of each phase. The figure-17 is displayed when you press 

the Down button.


Figure-17:


It shows the minimum apparent power values of each phase. The figure-1

8

 is displayed when 

you press the Down button.


Figure-18:


It shows the maximum apparent power values of each phase. The figure-1

9

 is displayed when 

you press the Down button.


Figure-19:


It shows the mean apparent power


values of each phase. The figure-

20

 is displayed when you 

press the Down button.


Figure-20:


It shows the apparent power demand  values of each phase. The figure-

21

 is displayed when 

you press the Down button.

Figure-16

L1

L2

L3

S

kVA

kVA

kVA

Out1

Figure-18

L1

L2

L3

S

kVA

kVA

kVA

Out1

S

kVA

kVA

kVA

Out1

Şekil-20

S

L1

L2

L3

kVA

kVA

kVA

Out1

Figure-19

S

L1

L2

L3

kVA

kVA

kVA

Out1

Figure-17

L1

L2

L3

L1

L2

L3

I

A

A

A

Out1

L1

L2

L3

I

A

A

A

Out1

L1

L2

L3

I

A

A

A

Out1

L1

L2

L3

I

A

A

A

Out1

L1

L2

L3

I

A

A

A

Out1

Figure-11

Figure-12

Figure-13

Figure-15

Figure-14


Figure-11:

 It shows the current values of each phase. The figure-12 is displayed when you press the 

Down button.


Figure-12:


It shows the minimum current values of each phase. The figure-13 is  displayed when you 

press the Down button.


Figure-13:


It shows the maximum current values of each phase. The figure-14 is displayed when you 

press the Down button.


Figure-14:


It shows the mean current values of each phase. The figure-15 is displayed when you press 

the Down button.


Figure-15:


It shows the current demand current values of each phase. The figure-16 is displayed when 

you press the Down button.


-6-

Figure-31

Figure-30

Figure-27

Figure-28


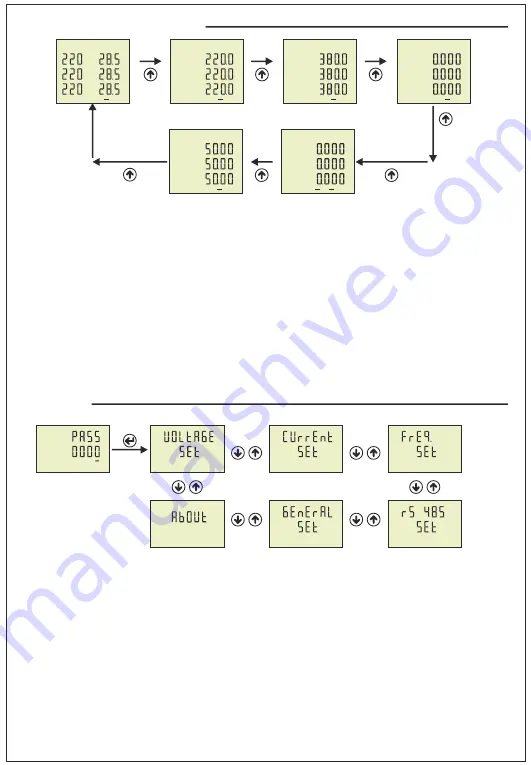
Figure-25:

  Press Menu button to enter password section. The figure-26 is displayed when you  enter 

password  and press the Menu button.


Figure-26:


It uses for voltage settings. The figure-27 is displayed when you press the UP button.


Figure-27:


It uses for current settings. The figure-28 is displayed when you press the UP button.


Figure-28:


It uses for frequency settings. The figure-29 is displayed when you press the UP button.


Figure-29:


It uses for RS-485 settings. The figure-30 is displayed when you press the UP button.


Figure-30:


It uses for general settings. The figure-31 is displayed when you press the UP button.


Figure-31:


It uses for about the device. This section give a information about device serial number and 

version number. You can use ESC button for exit menu.


Figure-25

Figure-26

 12 - Settings:

Figure-29

Set


The Home screen is displayed, when the device is energized. When you press the up button to see the 

other data on the display, the next data is displayed (Figure-3).


The figure-7 is displayed when you press the 

Up button. The figure-11  is displayed when you press the Up  button. The figure-16  is displayed when you 

press the Up  button. The figure-21  is displayed when you press the Up  button. The  screen back to 

Home Screen when you press the Up  button.

    I

f you want to see values of min,max,mean and demand you can use down button. If you back to 

home screen in anywhere, you can use ESC button.

 11 - To advance in Display Inventory:

L1

L2

L3

V

A

A

A

Out1

Home

Screen

Figure-3

L12

L23

L31

V

V

V

V

Out1

Figure-7

L1

L2

L3

I

A

A

A

Out1

Figure-11

L1

L2

L3

  F

Out1

Hz

Hz

Hz

Figure-21

L1

L2

L3

S

Var

Var

Var

Out1

Din1

Figure-16

I

L1

L2

L3

V

V

V

V

Out1

Содержание EM-07

Страница 1: ...es of V1 V2 V3 V12 V23 V31 F1 F2 F3 It shows the minimum maximum average and demand values of I1 I2 I3 S1 S2 S3 High Low voltage current frequency adjustable Phase Neutral or Phase Phase protection ad...

Страница 2: ...ase current and 3 phase voltage and neutral N L1 L2 L3 Load A1 A2 85 240VAC 50 60Hz 6VA B GND A RS485 COM NC OUT 5A 250VAC NO k3 k2 k1 Curent Transformer Connections l3 l2 l1 CT1 P1 S1 P2 S2 CT2 P1 S1...

Страница 3: ...gether with the device Place the switch or circuit breaker close to the device or in a location that is easily accessible for the operator Be sure that the panel to which the device is mounted does no...

Страница 4: ...surement values to another min max avg dmd State of Menu To navigate from menu parameters to another State of changing parameter Decrease value of parameter 7 Definition of Buttons 1 It shows phase nu...

Страница 5: ...when you press the Down button Figure 3 It shows the phase neutral voltage values The figure 4 is displayed when you press the Down button Figure 4 It shows the phase neutral minimum voltage values T...

Страница 6: ...shows the mean apparent power values of each phase The figure 20 is displayed when you press the Down button Figure 20 It shows the apparent power demand values of each phase The figure 21 is displaye...

Страница 7: ...l number and version number You can use ESC button for exit menu Figure 25 Figure 26 12 Settings Figure 29 Set The Home screen is displayed when the device is energized When you press the up button to...

Страница 8: ...19 Voltage Protection Type Figure 33 Figure 32 Set Esc V Figure 42 Figure 43 Figure 34 Figure 35 Figure 36 Figure 37 Figure 38 Figure 39 V V Figure 40 V Figure 41 Press Menu button and enter password...

Страница 9: ...e Determines delay close time If all voltage below the high voltage protect value as a hysteresis voltage relay output switches close at the end of the reset time Default 3sec Min 1sec Max 10000sec Pr...

Страница 10: ...medium voltage you can use VTR Default 1 Min 1 Max 999 Pr 13 Voltage Asymmetry Protection Reset Time Determines delay close time If calculated asymmetry value over the voltage asymmetry protect value...

Страница 11: ...Reset Enable Disable Pr 36 Current Transformer Ratio Pr 37 Current Fuses Enable Disable Pr 38 Demurrage Protection Enable Disable Pr 39 Demurrage Protection Time Pr 40 Demurrage Protection Factor Set...

Страница 12: ...ut switches close at the end of the reset time Default 10sec Min 1sec Max 10000sec Pr 27 Low Current Protection Reset Time Determines delay close time If all current below the low current protect valu...

Страница 13: ...c Min 1sec Max 10000sec Pr 33 Current Asymmetry Protection Hysteresis Required hysteresis current for current asymmetry warning is programmed Default 3 Min 1 Max 20 Pr 34 Current Asymmetry Protection...

Страница 14: ...hen you press the up button You enter Frequency set when you press Menu button If you enter Frequency set menu the figure 72 Pr 41 displayed This menu have 11 different current set value When you pres...

Страница 15: ...Disable Max Enable Pr 46 Low Frequency Protection Value Determines the minimum operating frequency value of load Default 49Hz Min 45 0Hz Max 70 0Hz Pr 47 Low Frequency Protection Delay Time Determine...

Страница 16: ...d to enter program list The figure 26 Voltage SET is displayed when you enter password and press the Menu button The figure 27 Current SET is displayed when you press the up button The figure 28 Frequ...

Страница 17: ...ty Default 1 Min 1 Max 20 Pr 58 Demand Record Delete You can delete demand and average records If cut off device energy min max average and demand values are deleted Figure 87 Figure 88 Figure 89 Figu...

Страница 18: ...ton until you see the General SET Step 2 Pr 54 is displayed when you press the SET button and press Up button You will see Pr 55 It is using for enable disable password protection It is deleted from s...

Страница 19: ...displayed when you press the SET button It is using for setting high current protection value It is deleted from screen when you press the SET button Step 3 You can increase decrease value to use Up D...

Страница 20: ...see the General SET Step 2 Pr 54 is displayed when you press the SET button and press Up button You will see Pr 57 It is using for setting demand time It is deleted from screen when you press the SET...

Страница 21: ...you press the SET button You can increase decrease value to use Up Down Button You can use SET button to save The figure 40 is displayed when you press the SET button Press Up button until you see th...

Страница 22: ...ecrease value to use Up Down Button You can use SET button to save The figure 56 is displayed when you press the SET button Press Up button until you see the Pr 20 figure 51 A A Figure 56 Pr 40 is usi...

Страница 23: ...Pr 16 Pr 11 Pr 2 Pr 21 Pr 26 Pr 42 Pr 47 Pr 31 Pr 39 Pr 40 Pr 7 Pr 12 Pr 3 Pr 22 Pr 27 Pr 43 Pr 48 Pr 32 Pr 8 Pr 13 Pr 17 Pr 18 Pr 19 High Voltage Value High Current Value Low Current Value High Freq...

Страница 24: ...www tense com tr 23 23 23 23 22 20 19 19 19 18 18 18 17 17 17 16 16 15 15 13 10 7 6 6 4 4 4 3 3 2 2 2 2 1 1 Connections Diagrams 26 Dimensions 28 Index 27 Technicial Specifications 29 Contact 25 Param...

Отзывы: