EN
21
10. Learning plan
Analyzes the input signal to the meter and
automatically detects all channels.
This feature automatically identifies the channels
as either analog or digital and performs
measurements on each.
A bar graph is displayed with the height
representing the power for digital channels and the
level of the video carrier for the analog channels.
The measurements made for analog channels are
video carrier level and V/A. For digital channels the
measurements are power and C/N.
The analog channels will have an extra, smaller
white bar indicating the level of the audio carrier.
10.1. Main window
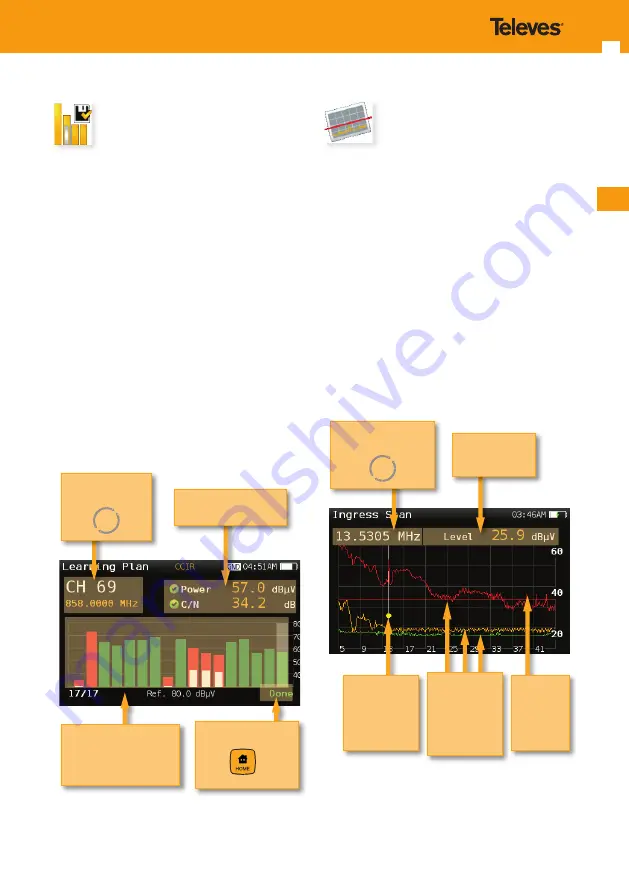
Below is a capture of a Learning Plan window with
a brief explanation of its features:
List of measurements
with pass/fail indicators
Bar graph representing
found channels
Color according to
checkmarks
Indicates that the
scan is finished.
Press
to save
the plan
Selected channel
Change using
11. Ingress Scan
Help identify reverse path problems before your
customers are affected.
Poorly shielded coaxial cable and faulty
terminations are important sources of ingress
noise which can easily add up in the return due to
the large number of subscriber-generated signals
that are sent back to the headend.
The combined and amplified interference is often
responsible for service disruption, so having a
good reverse path ingress scan tool is a must.
11.1. Main window
Below is a capture of an Ingress Scan window with
a brief explanation of its features:
Level of the
selected
frequency
Yellow mark:
indicates
the selected
frequency in
the spectrum
Red line:
indicates
the current
maximun
level
Red graph:
max-hold
Orange graph:
real-time
Green graph:
min-hold
Selected frequency
Change using


