56
5.8 Analyzing the Test Results
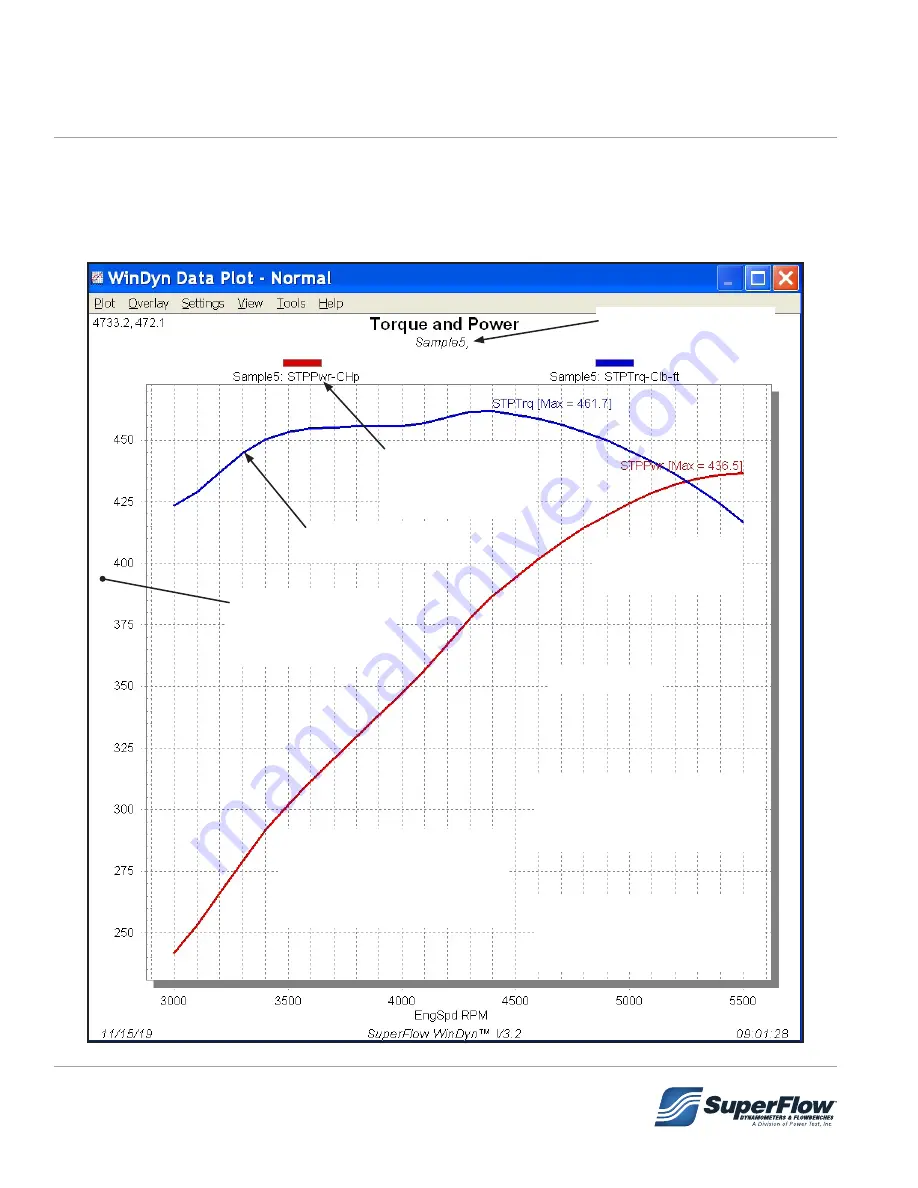
All automated tests will save the test data automatically on the computer. The recorded data can be
viewed, plotted, and printed using the WinDyn Stored Data Viewer.
NOTE:
Refer to the WinDyn operators manual for more information on how to use the Stored Data Viewer.
Double click here to add
overlays to your base plot.
Move cursor here, a
hand will appear. Left
click to access the
Channel Order Dialog.
Double click on data
point to see its value.
Double click in left or right
margins to customize the
plot format or change plot
titles.
Right click anywhere
in graph to change
plotting styles.
Press "Y" for dual Y-axis.
Press "M" for maximums.
Press "Z" to undo Zoom.
Press "F12" to toggle color mode.
Restore factory defaults via Shift >
File Menu > Preferences > Restore
Factory Defaults from Tabular data
screen.
Left click, hold and drag to zoom in
on any selection of a plot area.
Right click anywhere in the plot
area to access the menu to UNDO
the zoom function.
DATA PLOT
5.0 Operation
Содержание SF- 902S
Страница 34: ...30 Figure 4 6 CT700P Pressurized Cooling Tower 4 0 Installation...
Страница 38: ...34 Electrical Diagram 4 0 Installation...
Страница 61: ...57 DATA SHEET 5 0 Operation...


