12
PowerTalk2 User Manual - E1801_20181018 Rev.A
5�2 Activity
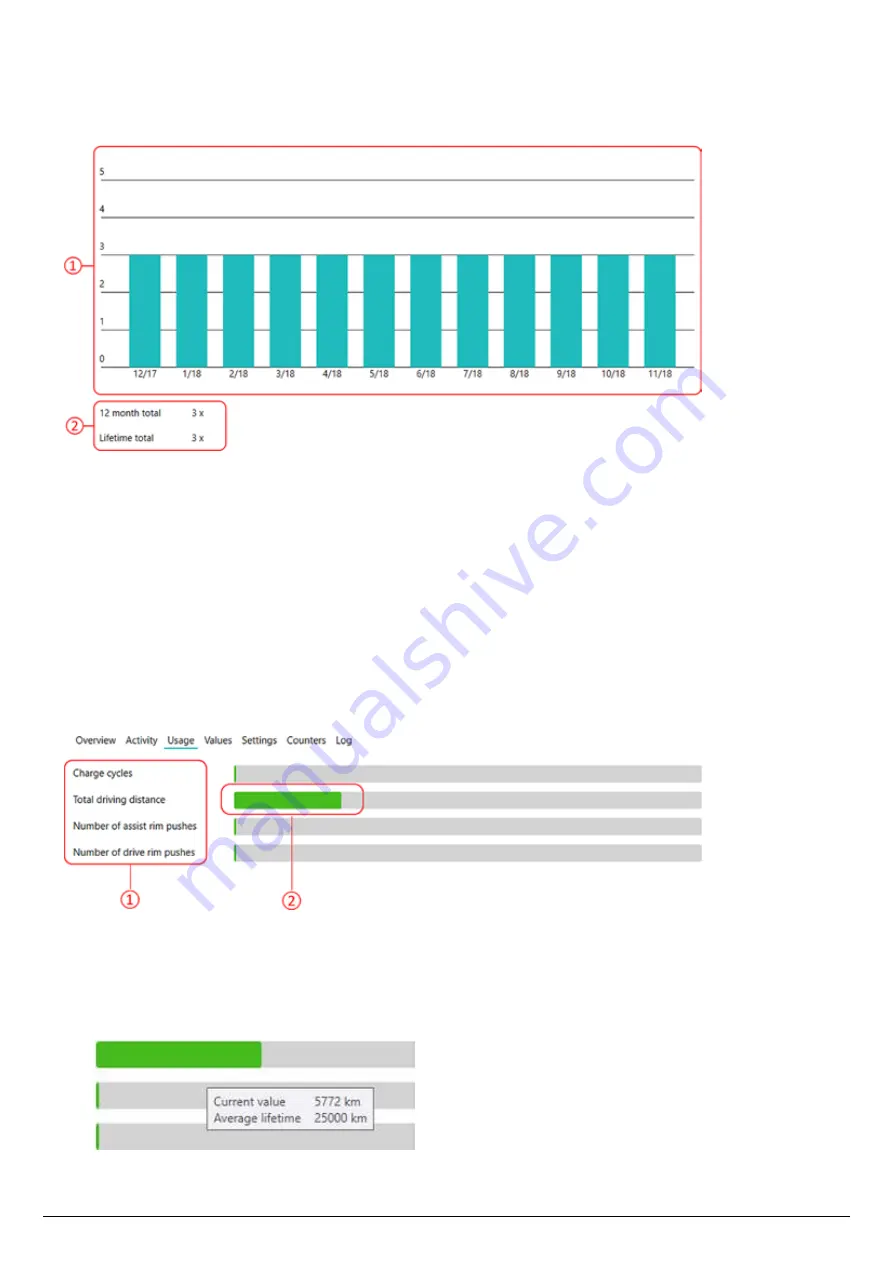
The Activity tab gives graphical information about the charging cycles.
1.
This field shows a charging cycle graph with on vertical axis the number of charging cycles and on the
horizontal axis the charging months. In this specific graph it becomes clear that in December of 2017 the
battery was charged 3 times and in the months after that, the battery was not charged. The graph only displays
full charging cycles, meaning that partial cycles are not counted.
2.
This field shows the number of charge events over the last 12 months and over the total lifetime of the battery
pack.
5�3 Usage
The usage tab gives information about the system usage, related to the expected life-time.
1.
This field gives the usage of the battery pack in charging cycles, the total driven distance with both rims and the
number of pushes with Assist and Drive rim.
2.
This field graphically displays the usage of counters mentioned above and related to the expected life-time.
When pointing with the cursor over the green or grey rows, detailed information is displayed, e.g.:


