


PowerForce
–
User Manual
Radlabor GmbH | Heinrich-von-Stephan-Str. 5c | 79100 Freiburg | Germany
www.smartfit.bike | www.radlabor.de
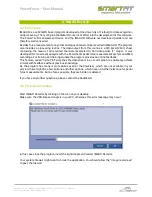
Click on the chart position, to add graphs to the according chart
To display the same selection in one line, this button
applies the selected buttons to both
graphs in one row.
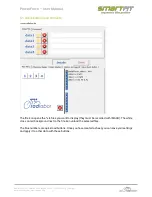
In the data selection, all recorded channels will be shown in the left drop down menu Up to 4 graphs
can be plotted in one chart.
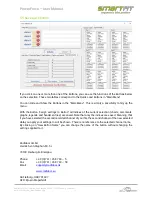
5.4 Caption and legend
Add manually Comments, which can be added to the header, label or legend
(1) Similar to the overview for the graph selection an overview window for the top bar and legend
labels exists. The left list represents the Top bar selection, the right one the legend selection.
Multiple choices are possible.
(2) By clicking on the chart position you can apply a name to the Chart in the Top bar and a
description with the color of the graph in a legend underneath the chart.
(3) If you want to assign the same parameters to all charts you can do this by using this button,
which selects all charts
3
2
1