SLS loudspeakers RLA 1 Скачать руководство пользователя страница 17

' SLS loudspeakers Inc., 2002. All rights reserved.

17

Conclusions

Based on the LASS program simulation, measurement data and analysis of various line
array design concepts, the following conclusions can be stated that:

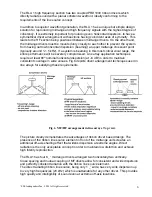
1.  Implementation of compression drivers in line array systems, where a coherent

planar wavefront is necessary to achieve line source performance, imposes
significant design difficulties and results in compromising the acoustical
parameters of such a system.

2.  The PRD 1000 planar ribbon driver allows for elegant line array design solutions

and provides a means for achieving consistent line source properties and wide
symmetrical horizontal dispersion over a wide frequency range.

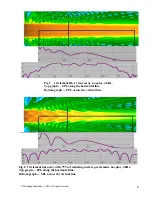
3.  The RLA1 ribbon line array system, based on the PRD1000 driver, demonstrates

far superior performance over line arrays based on conventional compression
driver design.
The RLA1 provides:

-

  much better coverage consistency, SPL deviation along the RLA1 coverage area is

significantly lower, without      pronounced SPL peaks and dips and areas with
dramatic loss of high frequency energy, inherent to other line arrays.

-    easily predictable coverage zone borderlines

-

  lower SPL loss with distance, within the coverage zone

-

  effective elimination of lobing and comb-filtering

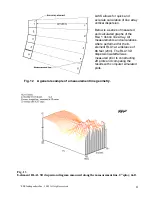
       4. The vertical polar diagram, as commonly defined, is not applicable to line arrays,

since it is valid, only if measured in a system’s far field.
 A line array’s dispersion diagram, observed along the array’s length (in the
simplest case this would be vertical dispersion) is a specific characteristic for a
specific distance. If measured, it is only valid for the distance at which the test was
performed. A dispersion diagram should be measured along the polygonal
measurement line defined above, not around the circle as for polars.

5.  A line array’s vertical dispersion has an infinite three-dimensional characteristic,

which depends on distance. It cannot be fully described by measurement data. It
can only be modeled with the help of such programs as the LASS, using
mathematical means, allowing for a near-field numerical simulation accounting for
the distance from each element and cannot be modeled by other programs that
use measured polar diagrams or far-field modeling only.

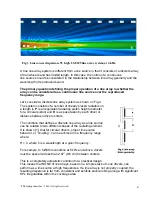
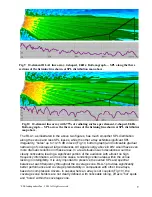
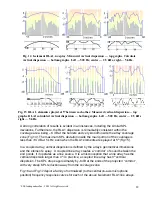
6.  The LASS Line Array Simulator Software is a powerful program for easy and quick

prediction of line array dispersion in the vertical plane (or horizontal plane if the
array is positioned accordingly). The results of simulation closely correlate with
actual measurements of the RLA1 line array. The comparison of simulated and
measured data also proves that the RLA1 possesses a coherent planar wavefront,
as assumed in LASS, and demonstrates line source behavior over a wide
frequency range.  Line arrays based on compression drivers, can be modeled by
introducing gaps between radiators with a certain filling coefficient.

Содержание RLA 1

Страница 1: ... addition to these misconceptions horn loaded compression driver technology imposes certain limitations preventing manufacturers from developing high performance line arrays with truly coherent dispersion In order to fully benefit from the implementation of the line source concept a line array system must incorporate transducers arranged in a continuous line that produces a coherent planar wavefro...

Страница 2: ...lation of the very essential near field and transition regions of a line array but rather describe its performance based on a far field model used for common point source systems Recognizing this need SLS Loudspeakers developed the LASS Line Array Simulator Software program It is an accurate software tool which allows for simulation of line array dispersion and prediction of sound field parameters...

Страница 3: ...g 3 will produce much smaller difference in SPL levels throughout the venue with SPL being significantly lower in close proximity to the source 18 dB 1m versus 30 dB for the point source This provides very comfortable listening conditions without the danger of overpowering the audience in the front rows cylindrical wavefront provides very controlled energy dispersion in the plane which coincides w...

Страница 4: ...s a space taken by each driver or distance between driver centers The condition that defines a discrete line array as a line source can be related to two different shapes of the radiating element It is shown 1 that for circular drivers proper line source behavior or coupling can be achieved in a frequency range where H λ where λ is a wavelength at a given frequency For example to fulfill this cond...

Страница 5: ...g waveguides also introduce significant distortion in addition to the distortion inherent to compression drivers Design B uses another approach Two compression drivers have sectored waveguides that supposedly generate a plane wave at the output by slicing a wave into thin segments and producing a line of secondary sound sources at the output Instead due to their different lengths there is a progre...

Страница 6: ...rely compromised Line array application techniques require at least 90 nominal horizontal dispersion at 6 dB in order to maintain consistent coverage in wide venues Fig 6 depicts driver arrangement techniques used in line arrays for satisfying these requirements The picture clearly demonstrates the advantages of ribbon driver based design The presence of the ribbon line source element in front of ...

Страница 7: ...e arrays is 16 8 feet and a simulation field is extended to 150 feet Dark lines represent hypothetical listening planes LASS allows for generation of SPL distribution diagrams along these planes The particular line arrangement depicted below illustrates SPL coverage consistency along the venue on the axis of the arrays and across the coverage zone along the line parallel to the array at a distance...

Страница 8: ...line array no splay 4 kHz Top graph SPL along the horizontal line Bottom graph SPL across the vertical line Fig 8 10 element line array with 75 of radiating surface per element no splay 4 kHz Top graph SPL along the horizontal line Bottom graph SPL across the vertical line ...

Страница 9: ...n a real situation such deviations would be clearly noticeable leaving a significant portion of the audience with almost no high frequency information and in some cases rendering certain areas within the venue lacking in intelligibility It is very important to preserve the overall SPL and spectral balance at each frequency throughout the coverage zone RLA 1 provides significantly better performanc...

Страница 10: ...repancy between line array polar diagrams If we were able to measure polar diagrams of a 3 m long line source at 5 50 and 500 meters we would observe different polar diagrams for different distances Therefore a line array dispersion diagram observed along the array s length in the simplest case this would be vertical dispersion is a particular characteristic for a particular distance In other word...

Страница 11: ... LASS allows for quick and accurate calculation of line array vertical dispersion Below is a series of measured and calculated graphs of the RLA 1 ribbon line array All measurements and calculations where performed for the 8 element RLA1 at a distance of 66 feet 20m The RLA1 3D dispersion waterfall was measured prior to constructing 2D plots and comparing the results with computer simulated plots ...

Страница 12: ...ource It is a misconception that a line array has the vertical dispersion larger than 0 In practice a coupled line array has 0 vertical dispersion The SPL drops approximately by 6dB at the ends of the projected corridor with very steep SPL reduction away from the coverage zone Fig 16 and Fig 17 depict a family of normalized to the central on axis microphone position frequency response curves for e...

Страница 13: ...RLA1 0 splay Family of frequency response curves measured along the measurement line across the coverage area at 66ft Fig 17 8 element RLA1 5 splay between elements Family of frequency response curves measured along the measurement line across the coverage area at 66ft ...

Страница 14: ...sponse is remarkably consistent and smooth within the main portion of the coverage up to 5 kHz with some deviations above this point Fig 18 depicts another interesting and very useful relationship the difference between measured frequency response of the straight RLA1 and the curved RLA1 with 5 splay between each element The microphone was placed in the middle of the coverage zone on symmetry axis...

Страница 15: ... sound quality but more importantly provides a much more reliable system with less hardware and shorter rigging time The LASS program allows for quick and vivid display of performance parameters such as SPL curves along the listening lines Using a comprehensive iterative process it is easy to design the optimum line array system for a given application As an example two RLA 1 line array configurat...

Страница 16: ... average levels throughout the venue The resulting system provides remarkably consistent coverage at only 10 dB SPL in mentioned 65ft 164 ft area and beyond up to the farthest seats yielding total 5 dB SPL deviation throughout the entire venue It is worth noting that both systems have the same number of elements and the same total vertical coverage angle Hardly any level shading or other DSP proce...

Страница 17: ...to line arrays since it is valid only if measured in a system s far field A line array s dispersion diagram observed along the array s length in the simplest case this would be vertical dispersion is a specific characteristic for a specific distance If measured it is only valid for the distance at which the test was performed A dispersion diagram should be measured along the polygonal measurement ...

Страница 18: ...he only method feasible for accurate prediction is the combination of LASS simulation data in vertical plane with measured data of one array element in the horizontal plane Using interpolation techniques and both types of data it would be possible to generate a directivity balloon which would be the closest approximation to a real system Author Igor Levitsky Many thanks go to Tom Harrison for help...

Отзывы: