


' SLS loudspeakers Inc., 2002. All rights reserved.
12
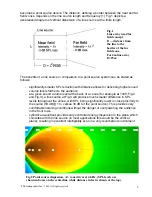
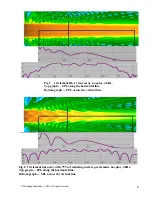
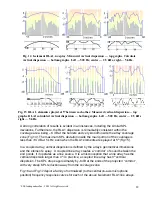
A strong correlation of results is evident in all instances, including the similar SPL
deviations. Furthermore, the RLA1 dispersion is remarkably consistent within the
coverage area, being – 6 dB at the borders and very smooth inside the array coverage
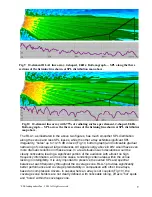
zone (Fig.14). The maximum SPL deviation inside the main portion of the coverage is
less than
±
3 dB at 5 kHz, even when the RLA1 elements are splayed at 5
°
(Fig.15).
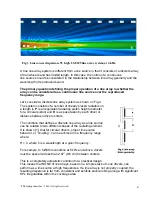
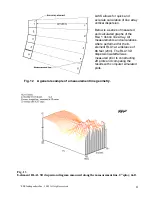
In a coupled array, vertical dispersion is defined by the array’s geometrical dimensions
and the elements’ splay. A coupled line array creates a “corridor” of sound between the
end points, if it operates as a line source. It is a misconception that a line array has the
vertical dispersion larger than 0
°
. In practice, a coupled line array has 0
°
vertical
dispersion. The SPL drops approximately by -6dB at the ends of the projected “corridor”,
with very steep SPL reduction away from the coverage zone.
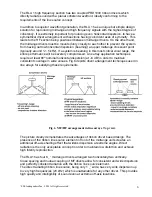
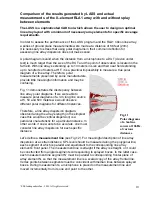
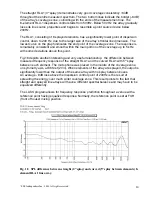
Fig.16 and Fig.17 depict a family of normalized (to the central on-axis microphone
position) frequency response curves for each of the above 8-element RLA1 line arrays.
The degrees depicted by
TEF should be replaced
for inches along the
measurement line.
Fig. 14 8-element RLA1, no splay. Measured vertical dispersion — top graphs. Calculated
vertical dispersion — bottom graphs. Left — 500 Hz, center — 2.5 kHz, right — 5 kHz.
Fig. 15 RLA1, elements splayed at 5
°
between each other. Measured vertical dispersion — top
graphs. RLA1 calculated vertical dispersion — bottom graphs. Left — 500 Hz, center — 2.5 kHz
right — 5 kHz.