


Technical description and operating manual ST 167 and ST167W5
29
The lower right panel provides an indication of the ST167 in real time in graphical form:
At the top of the window are the buttons:
• "Maximize" provides the extension of this panel in full screen.
• “Clear” - deletes the accumulated data and starts accumulation again.
• “Save” - when the button is pressed, the result of the ST167 operation will be written to the file. At
clicking the existing file again will overwrite it with the addition of new information.
• “Autoscroll” - enables automatic scrolling to the end of the chart as new data arrives
Depending on which mode “AUTO” or “MANUAL” ST167 is in, the way the information is displayed
in this panel will change.
In the “AUTO” mode, the active detection channels (GSM900, GSM1800, WLAN, etc.) are
shown along the Y axis. The X axis is the timeline. When the product detects a signal in a channel, a
colored rectangle will appear on the diagram. The position and length of the rectangle depend on the
start time and duration of the event. For example, if at 18:00 a signal was recorded on a GSM900
channel lasting 15 seconds, then a rectangle opposite the inscription “GSM900” will appear on the
diagram, which will start at 18:00:00 on the X scale and end at 18:00:15 .
The absolute length of the rectangle depends on the scale along the X axis.
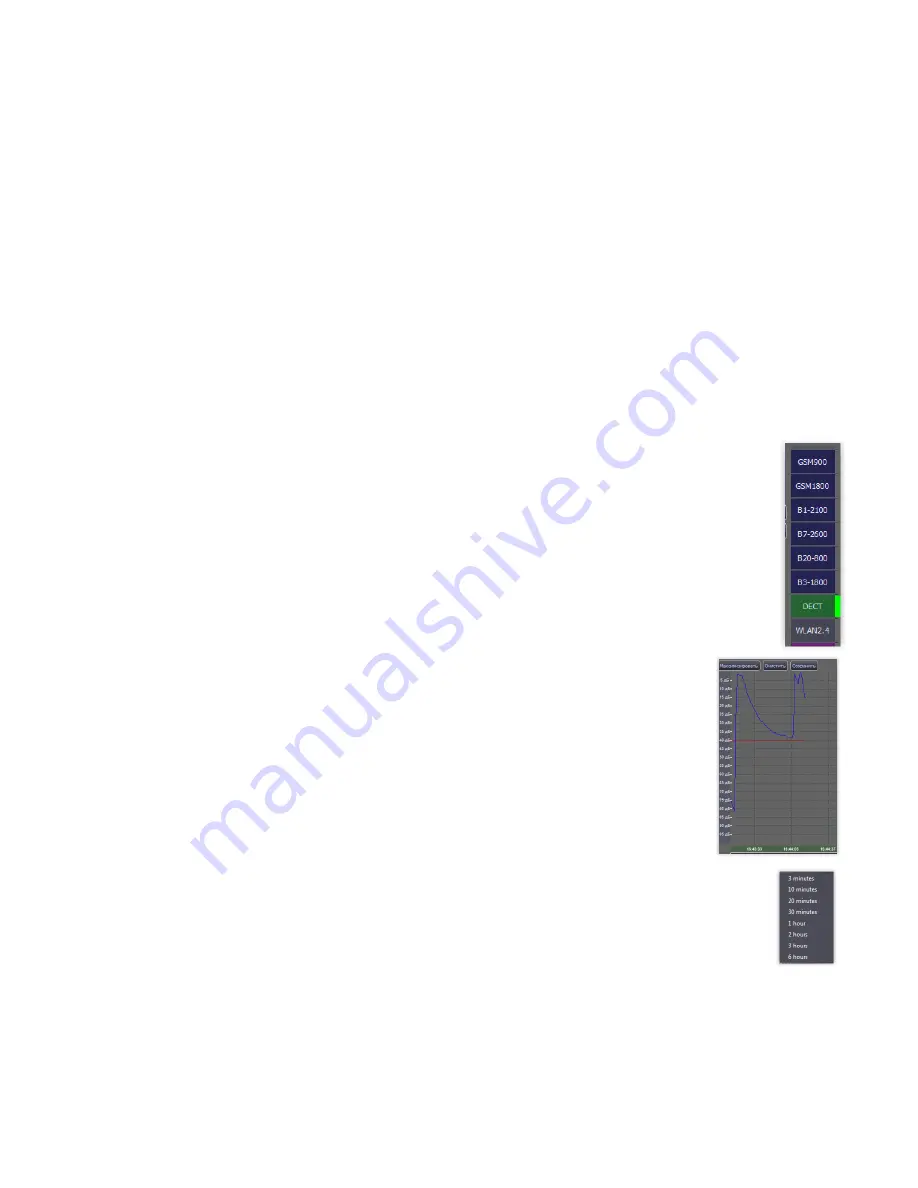
In “MANUAL” mode, the diagram displays a graph of the signal level in the
selected channel (blue line) together with the threshold level (red line).
When you hover over the X-axis area, the mouse pointer changes to a bidirectional
arrow. If the accumulation has exceeded the width of the screen, then the minimum and
maximum boundaries of the visible range can be changed. If you move the mouse cursor
left or right with the left mouse button pressed near the beginning of the axis, the
beginning of the range is adjusted, if near the end then the end of the range..
Right-clicking will bring up a context menu with a list of predefined visible ranges
.
If scrolling of the chart is available, when you hover over the charting area, the pointer takes the form
of a hand. If you press the left mouse button and, without releasing it, move the cursor to the right or left, the
chart will scroll (a tooltip with the current coordinates of the cursor will appear near the cursor).


