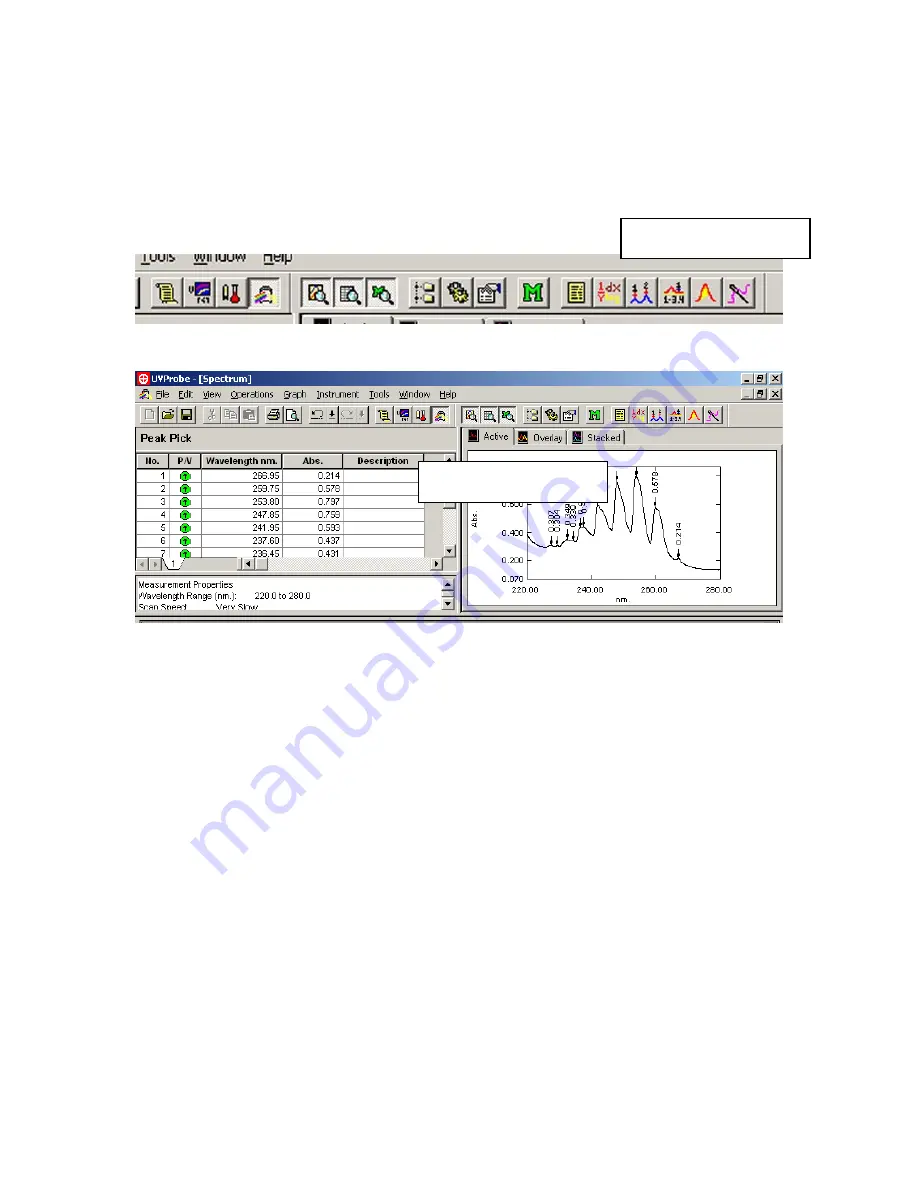
How to label peaks on your spectrum:
Click on the Peak Pick button on the toolbar.
¾
Peak Pick button
The Peak Pick table will then appear on the left side of the screen.
»
Peak Pick Table
Right-click the mouse on the Peak Pick table, and left-click on Properties.
You can then change parameters, such as the threshold for labeling peaks, and whether
the graph is labeled with the peak table number or the actual absorbance value, and
whether peaks or valleys are labeled.
After you have set up the Peak Pick table the way that you want, click on the Peak Pick
table to make it the active window. Then click on File, Print Preview. The report
generator will show you how the printout will appear. If it looks ok, then click on Print.
Please Note:
If the spectrum graph is selected as the active window, you will get a different
looking report than if the peak table is selected as the active window, prior to
clicking on Print Preview.


