


45
5 SePem 01 Master
The bottom section of the window shows the additional logger
data (
DEVNO
,
Comment
) for the logger selected in the list above.
Note:
All associated logger data will be also deleted when a logger is
deleted from the logger database.
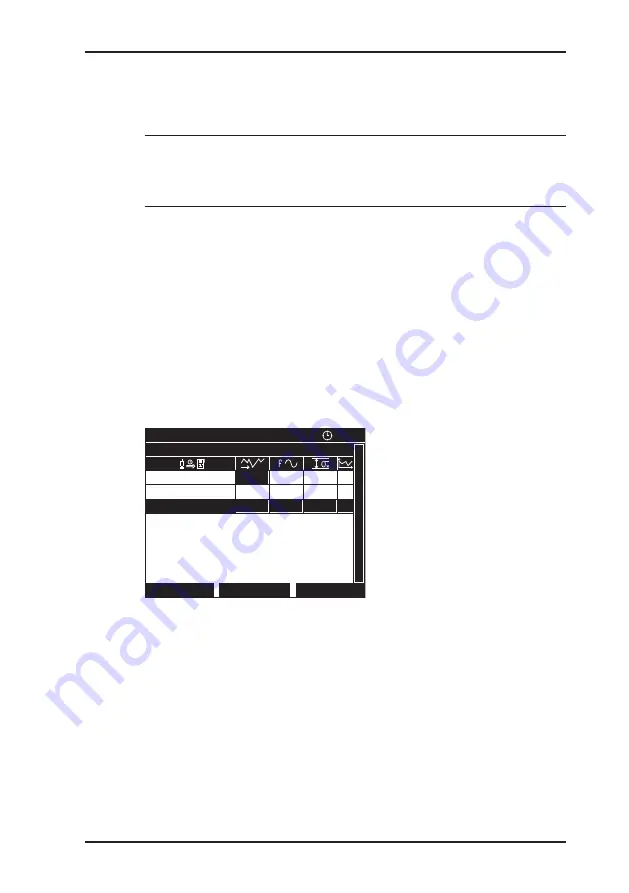
History
A
History
is saved for each logger. This contains the measure-
ment results for all measurement readings (time of reading, mini-
mum noise level, width, characterising frequency). If the extended
data set was read out then this will also be saved (indicated by
an 'x' in the last column; see also
Section 5.5.2.4, second table).
1. Select a logger from the
logger database
.
2. Press the jog dial. The
HISTORY
window will appear.
HISTORY
10:21
100 02 01371
15.01.10-08:59
475
253
317
237
102
X
15.01.10-11:22
12.01.10-14:11
Delete list
Back
Hist. graph
X
754
15
516
826
Fig. 17: History
3. Optional:
Viewing the graphics
Select a measurement result that includes an extended data
set (and confirm). The
GRAPHICS
window will appear.