4-5
rEm
star
p
lus
m s
ErIEs
u
sEr
m
anual
4.3.1.1
v
IEWIng
d
ata
on
thE
p
atIEnt
d
ata
s
CrEEns
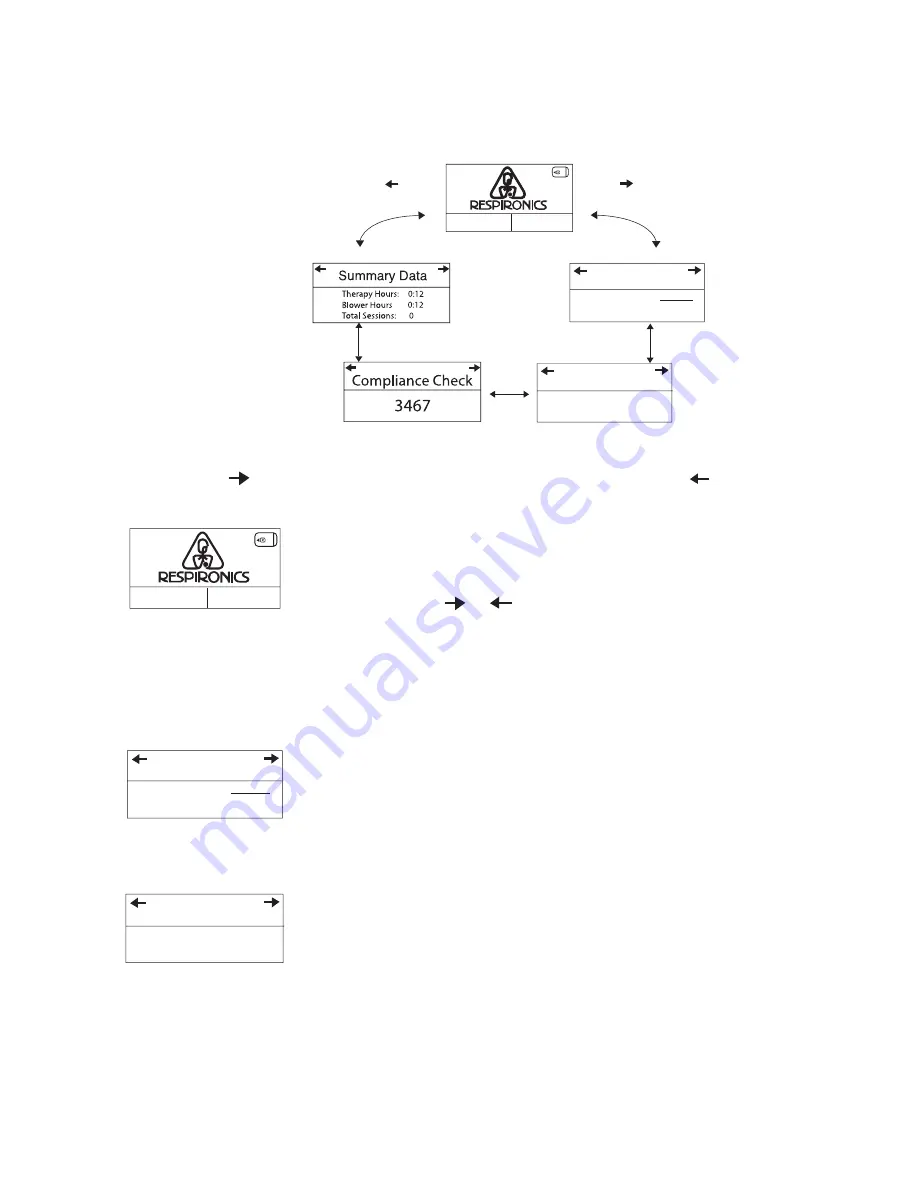
Figure 4–6 shows how to navigate the Patient Data screens.
Press
Press
7 Days: 5 Sessions
30 Days: 8 Sessions
– FOSQ
+
Setup
Therapy Usage
7 Day Avg:
5:00
30 Day Avg:
8:00
Hrs/Night
Sessions > 4
f
IgurE
4–6 n
avIgatIng
thE
p
atIEnt
d
ata
s
CrEEns
Press the button to scroll forward through the data screens, or press the button to scroll
through the screens in the reverse order. The Patient Data screens are described below.
– FOSQ
+
Setup
1.
Standby Screen
The Standby screen appears when you first apply power to the
device. You can access the Patient Data menu from this screen by
pressing the or buttons.
Note:
You can also access the Patient Setup screens by pressing
the + button, and the FOSQ questionnaire by pressing the
— button, as described later in this chapter.
Note:
The FOSQ option only appears if a SmartCard is inserted or
a modem is connected to the device.
Therapy Usage
7 Day Avg:
5:00
30 Day Avg:
8:00
Hrs/Night
2. Therapy Usage Screen
This screen displays the number of hours that the device provided
therapy, as 7-day and 30-day averages. The maximum value that can
be displayed for both averages is 24 hours.
Note:
This screen is only for reference. Your home care
provider may periodically ask you for this information.
7 Days: 5 Sessions
30 Days: 8 Sessions
Sessions > 4
3. Sessions Greater than 4 Hours Screen
This screen displays the number of device therapy sessions that
exceeded 4 hours in 7-day and 30-day periods. The maximum value
for the 7-day period is 35 sessions, while the maximum value for the
30-day period is 150 sessions.
Note:
This screen is only for reference. Your home care
provider may periodically ask you for this information.


