reedinstruments
www
com
11
Pantone 534 Blue
Pantone 123 Yellow
Pantone 485 Red
Pantone 123 Yellow
Pantone 534 Blue
Black
Rich Black -
20/20/20/100
Blue - 100/80/30/5
Yellow - 0/27/100/0
Red - 10/100/100/5
Yellow - 0/27/100/0
Blue - 100/80/30/5
Only if you REALLY need them:
Pantone 534 Blue - 100/80/30/5
Pantone 485 Red - 10/100/100/5
Pantone 123 Yellow - 0/27/100/
INSTRUMENTS
Graph
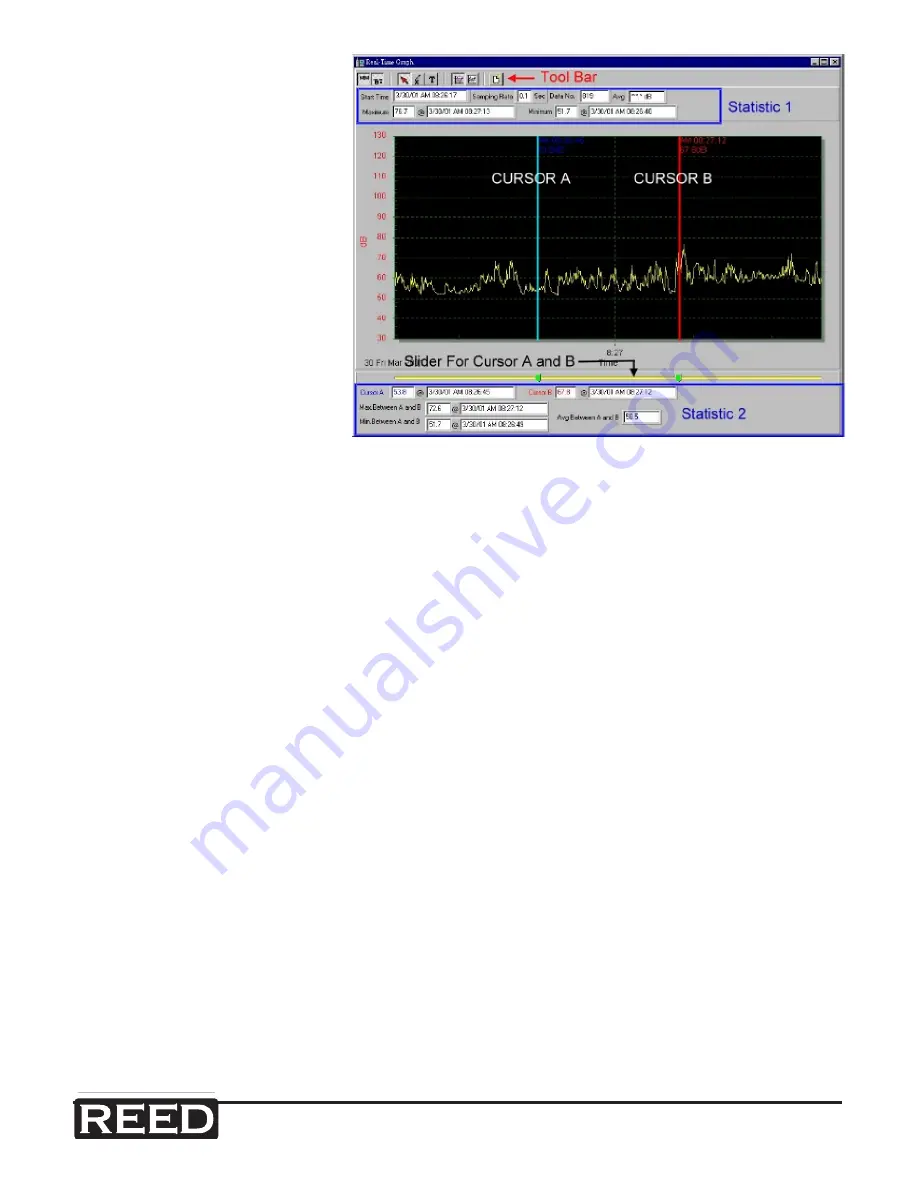
You can choose a rectan-
gle area on the graph to
zoom in for detail. There
are two vertical lines (Cur-
sor A and Cursor B) in the
graph. Time and value are
displayed on the top and
right side of each cursor.
You can move the mouse
cursor over Cursor A or
B and click to select and
drag the mouse cursor to
move these cursors left or
right. Right below Cursor A and B is a slider. You can also click and drag
slider to move Cursor A or B.
At the top of this screen are the statistics/values for the Start Time, Sam-
pling Rate, Data Number, Maximum and Minimum values of the graph. At
the bottom of the screen are the statistics/values for the maximum and
minimum average between Cursor A and B. This data will update automati-
cally when Cursor A or B are moved.
You can double click the graph to call up the option dialog. In the option
dialog, you can customize your graph style.
You can also right click the graph (real time graph is not allowed) to call up
the popup menu.
To Zoom into this graph using the mouse, Left click (click the left mouse
button) and drag the cursor to select the new extents and release the
mouse button.
To Undo the Zoom, Right click on the graph, you will see a pop-up menu,
select Undo Zoom.
Shop for Data Logging products online at:
www.
DataLoggerStore
.com
1.877.766.5412


