Perfect-Q-4
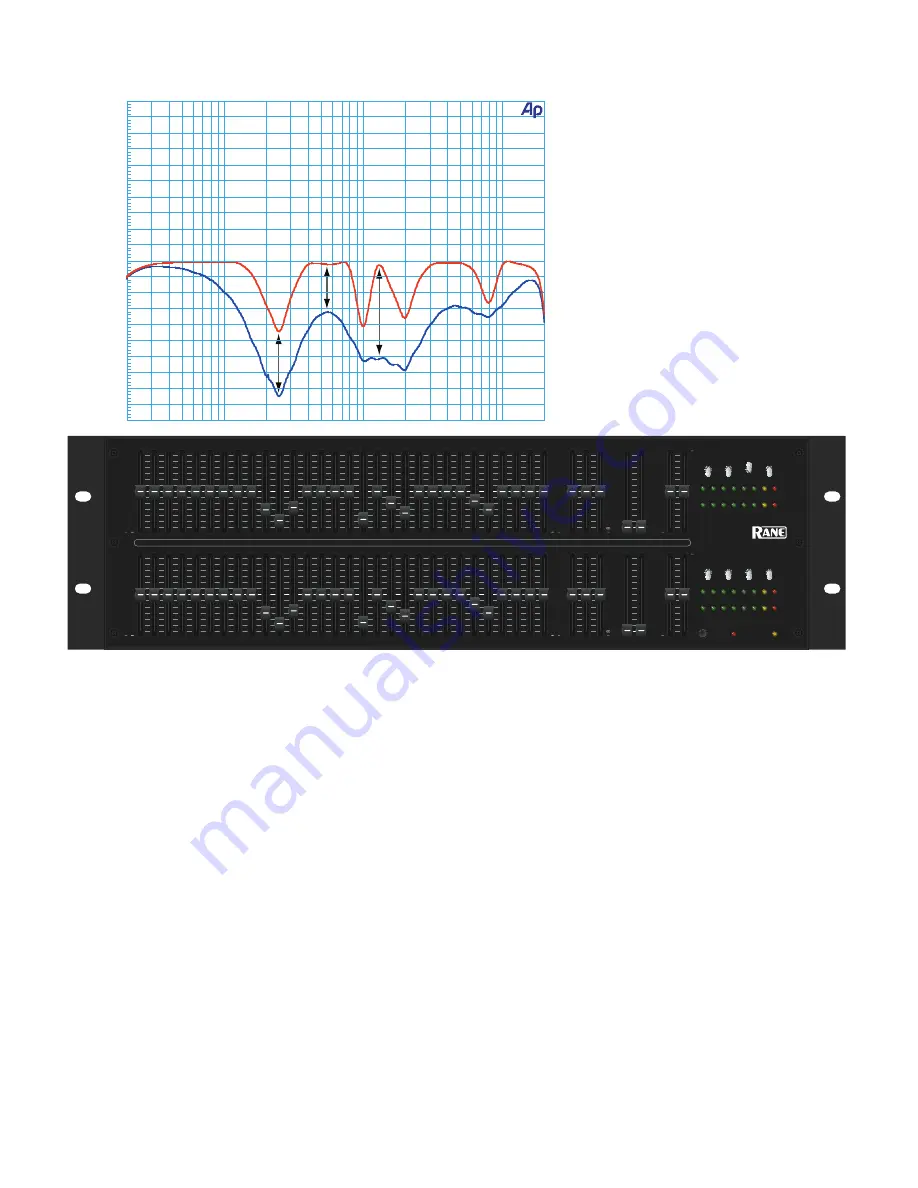
Figure 6. Perfect-Q versus Proportional-Q settings
-10
+10
-9
-8
-7
-6
-5
-4
-3
-2
-1
-0
+1
+2
+3
+4
+5
+6
+7
+8
+9
d
B
r
A
20
20k
50
100
200
500
1k
2k
5k
10k
Perfect-Q™
4 dB error
3 dB error
6 dB error
Proportional-Q
GRAPHIC EQUALIZER
∞
6
7k
14k
5k
10k
20k
15
120
30
240
60
+6
-12 -6
-3
0
+3
+12 OL
+6
-12 -6
-3
0
+3
+12 OL
12
12
12
12
+
0
+
0
+
0
∞
6
7k
14k
5k
10k
20k
15
120
30
240
60
12
12
12
12
+
0
+
0
+
0
CUT-ONLY
12
4
8
5
7
3
2
10
1
11
9
0
6
CUT
12
4
8
5
7
3
2
10
1
11
9
0
6
CUT
6
2
4
•
•
•
1
5
•
•
•
0
3
CUT
6
2
4
•
•
•
1
5
•
•
•
0
3
CUT
5.0k
25
31.5
40
50
63
80
100
800
125
160
200
250
500
400
315
630
2.0k
1.25k
1.0k
1.6k
3.15k
2.5k
4.0k
12.5k
8.0k
6.3k
10k
16k
20k
LOW MID HIGH
LOW HIGH
IN
OUT
POWER
B
EQ
EQ
PROPORT-Q
OUT
IN
PERFECT-Q™
BYPASS
A
±12
CUT FILTERS
TONE
LEVEL
DEQ 60L
A
B
A
B
B
PROPORT-Q
OUT
IN
PERFECT-Q™
BYPASS
A
±12
12
4
4
2
2
6
8
8
10
10
6
12
0
+
12
4
4
2
2
6
8
8
10
10
6
12
0
+
±6
±6
6
2
2
1
1
3
4
4
5
5
3
6
0
+
6
2
2
1
1
3
4
4
5
5
3
6
0
+
Getting From There to Here
Condensed to its essence, Perfect-Q is a proprietary
method for linearizing filter band interaction using
variable-Q techniques, which makes getting from set-
tings to response very accurate.
With that as the end, let’s go back to the beginning
and see how we got here:
Graphic equalizers are constructed from a set of
filters evenly spaced on a logarithmic frequency scale,
providing a relatively narrow-band adjustment of the
audio spectrum. Typically there is a one-third-octave
spacing. Each filter affects a band of frequencies cen-
tered about the specified center frequency, and is set
flat, having no effect, or adjusted to boost or cut, ampli-
fying or attenuating its frequency band.
Graphic equalizers suffer from overlapping band
problems, where adjusting one band adjusts adjacent
bands to a lesser, but significant extent, resulting in a
frequency response not matching the settings. Creat-
ing a response matching the settings makes equalizers
easier to use.
Various techniques exist to achieve this aim: you
can use complex filters, which have negligible effect on
adjacent bands, however narrow bandwidths require
lots of expensive computing power. Alternatively, add-
ing extra filters can compensate for the interaction. Or
most commonly, adjusting the filter settings on the fly
to approximately yield the desired response.
Several techniques can accomplish this last method.
Different iterative methods exist, where adjustments
are made, the error analyzed, then adjustments are
made again and so forth, until the error is sufficiently
small. This is what a person who could see the ampli-
tude vs. frequency response would do. Although a com-
puter does it much faster, this equalizing-the-equal-
izer procedure still results in an undesirable time lag
between changing settings and the desired response.
What you see is what you’ve cut…
or boosted
If all that doesn’t impress you, look at this
example where DEQ 60 slider positions
are lined up with the frequency responses
corresponding to the Perfect-Q and
Proportional-Q settings. There’s a scoop
around 250 Hz to remove some low-mid
woof, a few notches around 1 kHz and
2 kHz for feedback control, and a dip in
the 8 kHz region to tame a pesky high
frequency hot spot. Note the difference
between the two curves, especially the
interactions between adjacent bands in
the low-mids and the 6 dB offset at 1.25
kHz. Which EQ curve looks more like the
front panel slider positions? Which one is
perfect?


