background image

Trying Out the Instrument

R&S

®

FSVA3000/R&S

®

FSV3000

60

Getting Started 1330.8073.02 ─ 04

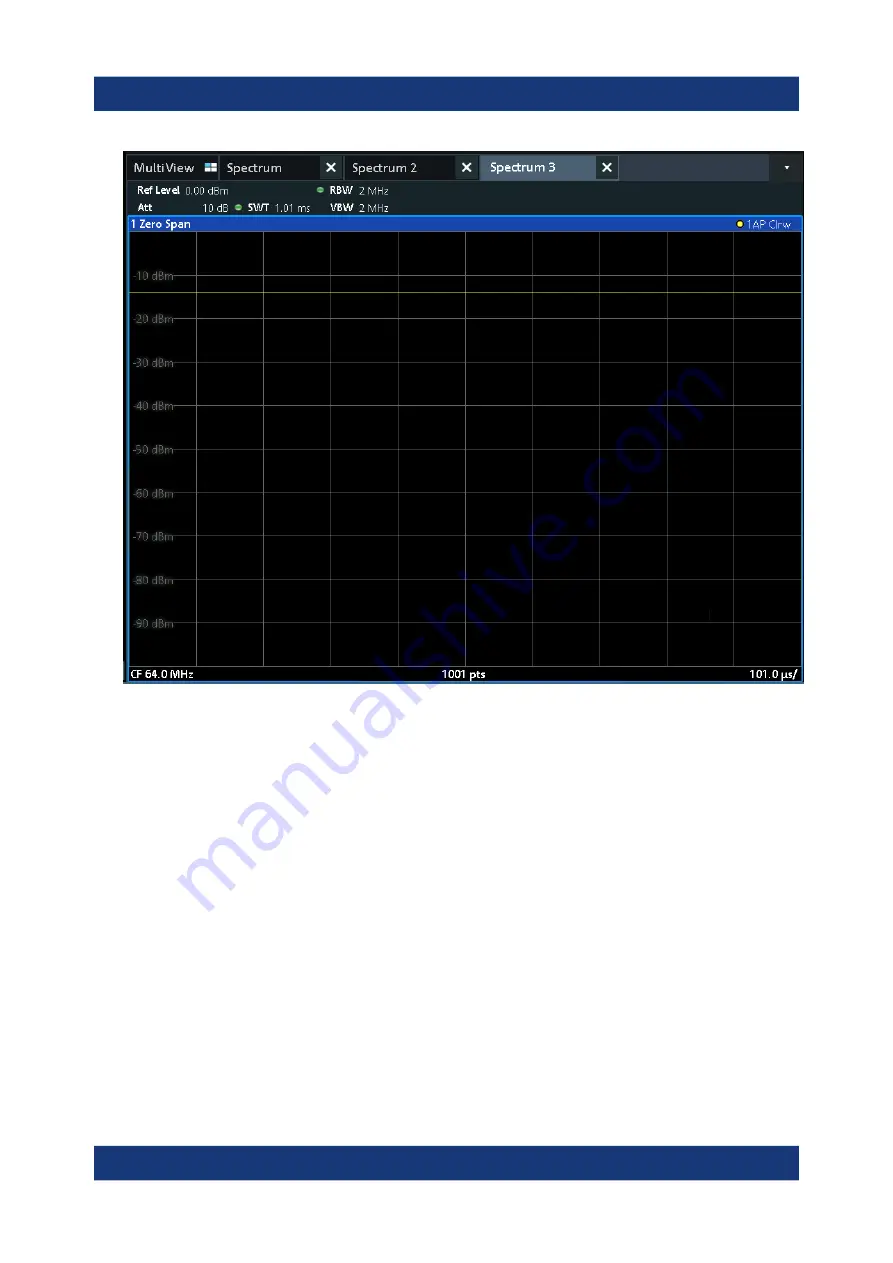
Figure 6-7: Time domain display of the calibration signal

5. Create a new channel for I/Q analysis:

a) Press the [Mode] key.
b) Tap the "IQ Analyzer" button to activate a channel for the I/Q Analyzer

application.

c) Tap the "Display Config" softkey to activate the SmartGrid mode.

Activating Additional Measurement Channels

Содержание FSVA3000 Series

Страница 1: ...000 R S FSV3000 Signal and Spectrum Analyzer Getting Started 1330807302 Version 04 N 2 Sie haben Fragen oder w nschen eine Beratung Angebotsanfrage unter 07121 51 50 50 oder ber info datatec de Distri...

Страница 2: ...049 XX R S FSV3 B25 Electronic attenuator 1330 4078 02 R S FSV3 B40 40 MHz analysis bandwidth extension 1330 4103 02 R S FSV3 B114 enhanced computing power 1330 4910 02 R S FSV3 B200 200 MHz analysis...

Страница 3: ...nt Security Procedures 13 2 5 Printed Safety Instructions 13 2 6 Data Sheets and Brochures 13 2 7 Release Notes and Open Source Acknowledgment OSA 14 2 8 Application Notes Application Cards White Pape...

Страница 4: ...he Instrument 52 6 1 Measuring a Basic Signal 52 6 2 Displaying a Spectrogram 55 6 3 Activating Additional Measurement Channels 57 6 4 Performing Sequential Measurements 62 6 5 Setting and Moving a Ma...

Страница 5: ...Contents R S FSVA3000 R S FSV3000 5 Getting Started 1330 8073 02 04 7 6 Getting Help 110 8 Contacting Customer Support 112 Index 113...

Страница 6: ...Contents R S FSVA3000 R S FSV3000 6 Getting Started 1330 8073 02 04...

Страница 7: ...ns on page 7 The same information is provided in many languages as printed Safety Instructions The printed Safety Instructions are delivered with the product Throughout the documentation safety instru...

Страница 8: ...d you can operate the product up to an altitude of 2000 m above sea level The product is suitable for pollution degree 2 environ ments where nonconductive contamination can occur For more information...

Страница 9: ...It complies with country specific safety requirements Only insert the plug into an outlet with protective conductor terminal Only use intact cables and route them carefully so that they cannot be dam...

Страница 10: ...aring damage Before using head phones check the volume and reduce it if necessary If you monitor varying sig nal levels take off the headphones and wait until the signal has settled Then adjust the vo...

Страница 11: ...Safety and Regulatory Information R S FSVA3000 R S FSV3000 11 Getting Started 1330 8073 02 04 1 3 Korea Certification Class A A Korea Certification Class A...

Страница 12: ...ternet 2 2 User Manuals and Help Separate user manuals are provided for the base unit and the firmware applica tions Base unit manual Contains the description of all instrument modes and functions It...

Страница 13: ...SV3000 Service manual 2 4 Instrument Security Procedures Deals with security issues when working with the R S FSV A in secure areas It is available for download on the Internet 2 5 Printed Safety Inst...

Страница 14: ...open source acknowledgment document provides verbatim license texts of the used open source software See www rohde schwarz com firmware FSV3000 www rohde schwarz com firmware FSVA3000 2 8 Application...

Страница 15: ...lel Optional measurement applications for demodulation of analog and digital modulated signals For a detailed specification refer to the data sheet Due to these features the R S FSV3000 and the R S FS...

Страница 16: ...rnal Monitor 23 Windows Operating System 25 Logging On 27 Checking the Supplied Options 30 Performing a Self Alignment 30 Considerations for Test Setup 31 Protecting Data Using the Secure User Mode 32...

Страница 17: ...you can operate the product The EMC class of the product is given in the data sheet under Gen eral data Class B equipment is suitable for use in Residential environments Environments that are directly...

Страница 18: ...an fall over and cause injury Never stack more than three products on top of each other Instead mount them in a rack Stack as follows It is best if all products have the same dimensions width and leng...

Страница 19: ...sheet b Mount the adapter kit Follow the assembly instructions provided with the adapter kit 2 Lift the R S FSV A to shelf height 3 Grab the handles and push the R S FSV A onto the shelf until the ra...

Страница 20: ...2 Plug the AC power cable into a power outlet with ground contact The required ratings are listed next to the AC power connector and in the data sheet For details on the connector refer to Chapter 5...

Страница 21: ...ata sheet the R S FSV A automatically shuts down to protect the instrument from damage To disconnect from power The R S FSV A is in the standby state 1 NOTICE Risk of data loss If you disconnect the p...

Страница 22: ...before performing the following tasks Connecting the instrument to the network Configuring the network Changing IP addresses Exchanging hardware Errors can affect the entire network Connect the R S FS...

Страница 23: ...configure the keyboard language 1 To access the Windows operating system press the Windows key on the external keyboard 2 Select Start Settings Time language Region language Add a lan guage 4 9 Connec...

Страница 24: ...uration dialog box Show only on 2 the maximum screen resolution of the monitor is used In this case you can maximize the R S FSV A application window and see even more details You cannot change the mo...

Страница 25: ...ettings if necessary 7 Select OK if the settings are suitable 4 10 Windows Operating System The instrument contains the Windows 10 operating system which has been con figured according to the instrume...

Страница 26: ...the Microsoft Update website and associated update server Instruments using Windows especially those that connect to a network should be updated regularly Firewall settings A firewall protects an inst...

Страница 27: ...ample Paint or WordPad IECWIN the auxiliary remote control tool provided free of charge and installed by Rohde Schwarz is also avail able from the taskbar or Start menu For details on the IECWIN tool...

Страница 28: ...e current instrument session However when the instrument s power is removed all data in volatile memory is erased For details see Chapter 4 15 Protecting Data Using the Secure User Mode on page 32 Pas...

Страница 29: ...OGIN REG 6 Press the ENTER key to confirm The auto login function is reactivated with the changed password It will be applied the next time the instrument is switched on Switching users when using the...

Страница 30: ...after updating the firmware you have to perform a self alignment to align the data to a reference source During self alignment do not connect a signal to the RF input connector Running a self alignme...

Страница 31: ...shielded RF and LAN cables Always terminate open cable ends Ensure that connected external devices comply with EMC regulations Preventing electrostatic discharge ESD Electrostatic discharge is most li...

Страница 32: ...nstead which remains available only until the instrument is switched off This data includes Windows operating system files Firmware shutdown files containing information on last instrument state Self...

Страница 33: ...ge is not possible the following functions are not available in secure user mode Firmware update Activating a new option key Furthermore since the SecureUser used in secure user mode does not have adm...

Страница 34: ...administrator rights must log on Switching users when using the auto login function In the Start menu select the arrow next to the Shut down button and then Log off The Login dialog box is displayed i...

Страница 35: ...view of R S FSV A 1 POWER key 2 USB connectors 3 System keys 4 Touchscreen 5 Function keys 6 Removable SSD slot 7 Navigation controls 8 Probe connector 9 Trigger 1 In Out connector 10 RF Input 50 con...

Страница 36: ...that sup port USB standard 3 0 5 1 3 System Keys System keys set the instrument to a predefined state change basic settings and provide print and display functions A detailed description of the corres...

Страница 37: ...ay At the top of the screen At the bottom of the screen Off Mode Provides the selection between applications 5 1 4 Touchscreen All measurement results are displayed on the screen on the front panel Ad...

Страница 38: ...depending on application 9 Instrument status bar with error messages progress bar and date time display All measurement results are displayed on the screen on the front panel Addition ally the screen...

Страница 39: ...ing functions is provided in the user man ual Table 5 2 Function keys Function key Assigned functions Basic measurement settings Freq Sets the center frequency and the start and stop frequencies for t...

Страница 40: ...ed Noise marker Noise Meas Phase noise Phase Noise n dB down function AM FM audio demodulation Peak list Marker Used for search functions of the measurement markers maxi mum minimum of the trace Assig...

Страница 41: ...movable solid state drive contains all measurement data from the R S FSV A allowing you to store the data securely in an external location If this option is installed the firmware is also stored on th...

Страница 42: ...e moves the selection bar vertically In windows or dialog boxes with a vertical scroll bar moves the scroll bar Arrow Left Arrow Right Keys The arrow left or arrow right keys do the following In an al...

Страница 43: ...nput from a connected device under test DUT to the R S FSV A which is then analyzed in an RF measurement Connect the DUT to the RF Input connector on the R S FSV A Do not overload the input For maximu...

Страница 44: ...with the supplied SMA caps 5 1 12 Noise Source Control Power Sensor The LEMOSA female connector is used to connect smart noise sources or Rohde Schwarz power sensors For a detailed list of supported n...

Страница 45: ...multiplying factor Thus they have the same function as an Enter key Esc key Closes all kinds of dialog boxes if the edit Mode is not active Quits the edit mode if the edit mode is active In dialog box...

Страница 46: ...d for future use 9 IEEE 488 IEC625 SCPI GPIB interface requires option R S FSV3 B5 10 Noise Source Control requires option R S FSV3 B28V 11 Trigger 2 In Out connector 12 REF In Out connectors 13 IF ou...

Страница 47: ...and DVI You can connect an external monitor or other display device to the R S FSV A to provide an enlarged display Two different types of connectors are provided for this purpose Display Port DVI di...

Страница 48: ...ise Source Control female connector is used to provide the supply voltage for an external noise source For example use it to measure the noise figure and gain of amplifiers and frequency converting de...

Страница 49: ...her device REF Input 2 10 MHz 1280 MHz 3 dBm 13 dBm To provide an external reference signal to the R S FSV A REF Output 1 1 MHz 100 MHz 0 dBm To provide a 640 MHz reference signal from the R S FSV A t...

Страница 50: ...External Generator Control section of the R S FSV A user manual 5 2 14 OCXO Option R S FSV3 B4 This option generates a 10 MHz reference signal with a very precise frequency If installed and if no ext...

Страница 51: ...life For more information see the prod uct user manual chapter Disposal 5 2 16 Device ID The unique device identifier is provided as a barcode sticker on the rear panel of the R S FSV A It consists of...

Страница 52: ...signal so you do not need any additional signal source or instruments Try out the following Measuring a Basic Signal 52 Displaying a Spectrogram 55 Activating Additional Measurement Channels 57 Perfo...

Страница 53: ...cy sweep is performed so that the spectrum of the calibration signal is now displayed in the standard level versus frequency diagram Figure 6 1 Calibration signal as RF input Instrument warmup time No...

Страница 54: ...onfiguration Overview b Tap the Frequency button c In the Center field enter 64 on the number pad on the front panel d Press the MHz key next to the number pad 2 Reduce the span to 20 MHz a In the Spa...

Страница 55: ...different colors Thus you can see how the strength of the signal varies over time for different frequencies 1 Tap the Overview softkey to display the general configuration dialog box 2 Tap the Displa...

Страница 56: ...apping the Close icon at the top right corner of the toolbar You see the spectrogram compared to the standard spectrum display Since the calibration signal does not change over time the color of the f...

Страница 57: ...you can define several measurement configurations in parallel and then switch between the channels automatically to perform the measurements sequentially We will dem onstrate this feature by activati...

Страница 58: ...annel tab of the Signal Spectrum Mode dialog box tap the Spectrum button Figure 6 5 Adding a new measurement channel 3 Change the frequency range for this spectrum display In the Frequency dialog box...

Страница 59: ...r span 4 Repeat the previous steps to activate a third Spectrum window Change the frequency range for this spectrum display In the Frequency dialog box set the center frequency to 64 MHz and tap Zero...

Страница 60: ...Time domain display of the calibration signal 5 Create a new channel for I Q analysis a Press the Mode key b Tap the IQ Analyzer button to activate a channel for the I Q Analyzer application c Tap the...

Страница 61: ...rting a Real Imag diagram for I Q analysis e Close the SmartGrid mode The IQ Analyzer channel displays the real and imaginary signal parts in sep arate windows To display the MultiView tab An overview...

Страница 62: ...the measure ments configured in the active channels can be performed sequentially that means one after the other automatically either once or continuously 1 Tap the Sequencer icon in the toolbar 2 To...

Страница 63: ...the channel active icon in the tab label 3 Stop the Sequencer by tapping the Sequencer softkey again 6 5 Setting and Moving a Marker Markers are useful to determine the position of particular effects...

Страница 64: ...e spectrogram display 4 Press the RUN SINGLE key on the front panel to perform a single sweep so we have a fixed trace to set a marker on 5 Press the MKR key on the front panel to display the Marker m...

Страница 65: ...frequencies and levels of peaks in the spec trum automatically We will display a marker peak list for the Spectrum 2 channel 1 Tap the Spectrum 2 tab 2 Press the RUN SINGLE key on the front panel to p...

Страница 66: ...for example define a threshold that is higher than the noise floor a Press the MKR key on the front panel b Tap the Marker Config softkey in the Marker menu c Tap the Search tab in the Marker dialog b...

Страница 67: ...lbar The icon is highlighted orange to indicate that multiple zoom mode is active 2 Tap the diagram near the first peak and drag your finger to the opposite corner of the zoom area A white rectangle i...

Страница 68: ...crease the number of sweep points from the default 1001 to 32001 a Press the Sweep key on the front panel b Tap the Sweep Config softkey in the Sweep menu c In the Sweep Points field enter 32001 d Pre...

Страница 69: ...3 02 04 Figure 6 15 Multiple zoom windows 5 Tap the Multiple Zoom icon in the toolbar again and define a zoom area around marker M8 6 To increase the size of the third zoom window drag the splitter be...

Страница 70: ...from Chapter 6 7 Zooming into the Display on page 67 were only graphical changes to the display Now we would like to change the measurement settings such that the zoomed result is maintained permanen...

Страница 71: ...d 1330 8073 02 04 3 Select the graphical zoom icon on the toolbar Any subsequent touch gestures define the zoom area for the zoom display 4 Place two fingers on the diagram to the left and right of th...

Страница 72: ...round the marker is enlarged in the result display 5 When the area has the size you require remove your fingers from the display The displayed span and the number of displayed sweep points is smaller...

Страница 73: ...ect Adapt Measurement to Zoom selected diagram The span of the measurement is changed and due to the automatic coupling of the span to the sweep time RBW and VBW those values are also changed The numb...

Страница 74: ...the instrument settings to a file 1 Tap the Save icon in the toolbar 2 Press the keyboard key on the front panel to display the online keyboard as you will have to enter text in the next step 3 In th...

Страница 75: ...wSetup dfl is stored in the default directory C R_S instr user To load stored instrument settings You can restore the settings to the instrument at any time using the settings file 1 Press the PRESET...

Страница 76: ...hen we will create a screenshot of the graphi cal display To export the trace data 1 Press the TRACE key on the front panel 2 Tap the Trace Config softkey 3 Tap the Trace Export tab 4 Tap the Export T...

Страница 77: ...Trying Out the Instrument R S FSVA3000 R S FSV3000 77 Getting Started 1330 8073 02 04 Figure 6 18 Screenshot of the current display Printing and Saving Results...

Страница 78: ...sing the web browser interface in a LAN network Using the Windows Remote Desktop application in a LAN network Connecting a PC via the GPIB interface How to configure the remote control interfaces is d...

Страница 79: ...pecific information depending on measurement application 6 Instrument status bar with error messages progress bar and date time display Hiding elements in the display You can hide some of the elements...

Страница 80: ...splayed on the screen To switch from one channel display to another simply select the corresponding tab If many tabs are displayed select the tab selection list icon at the right end of the channel ba...

Страница 81: ...n on channel specific settings for the mea surement is displayed in the channel bar Channel information varies depending on the active application In the Spectrum application the R S FSV A shows the f...

Страница 82: ...selected frequency sweep mode FFT manually selected FFT sweep mode Icons for individual settings A bullet next to the setting indicates that user defined settings are used not auto matic settings A g...

Страница 83: ...deactivated GAT The frequency sweep is controlled via the TRIGGER INPUT connector TDF The specified transducer factor is activated 75 The input impedance of the instrument is set to 75 FRQ A frequency...

Страница 84: ...ows Each win dow can display either a graph or a table as a result of the channel measurement Which type of result evaluation is displayed in which window is defined in the dis play configuration see...

Страница 85: ...d the x axis and y axis positions of the last two markers or delta markers that were set are displayed if available as well as their index The value in the square brackets after the index indicates th...

Страница 86: ...rement 7 1 4 Frequency and Span Information in Diagram Footer The information in the diagram footer beneath the diagram depends on the cur rent application measurement and result display For a default...

Страница 87: ...eration is displayed in the status bar In the MultiView tab the progress bar indicates the status of the currently selected measurement not the measurement a Sequencer is currently per forming for exa...

Страница 88: ...k is displayed next to the channel name This is particularly useful when the MultiView tab is displayed as the status bar in the MultiView tab always dis plays the information for the currently select...

Страница 89: ...er Manual for details You can also configure which icons are displayed in the toolbar For details see General Instrument Setup in the R S FSV A User Manual If the list of available icons becomes longe...

Страница 90: ...ed to define the zoom area the selected diagram is replaced by a new diagram which displays an enlarged extract of the trace This function changes the behavior of finger gestures such as dragging or s...

Страница 91: ...ly View Signal Generator Displays the screen of a connec ted signal generator If no generator is connected yet a connection dialog is dis played For details see Signal Generator Settings in the R S FS...

Страница 92: ...missing option You can hide the softkey display e g when using remote control to enlarge the display area for the measurement results Setup Display Displayed Items See the User Manual for details 7 2...

Страница 93: ...applications the context menu contains functions for the selected item These functions correspond to the functions also provided for the item in softkey menus This is useful for example when the soft...

Страница 94: ...screen Keyboard displayed at the bottom of the screen No keyboard displayed You can use the TAB key on the on screen keyboard to move the focus from one field to another in dialog boxes 7 3 Entering D...

Страница 95: ...nob and function keys do not work Use the touchscreen instead 7 3 1 Entering Numeric Parameters If a field requires numeric input the keypad provides only numbers 1 Enter the parameter value using the...

Страница 96: ...cil icon to toggle between entry modes 4 To change the unit a Press the right arrow key and scroll past the last digit to select the unit list b Use the up and down arrow keys to scroll through the av...

Страница 97: ...ue is displayed 4 With every key stroke the next possible value of this key is displayed If all possible values have been displayed the series starts with the first value again For information on the...

Страница 98: ...V 2 3 W X Y Z 3 0 blank 0 _ toggles between capital and small letters 7 4 Touchscreen Gestures A touchscreen allows you to interact with the software using various finger ges tures on the screen The b...

Страница 99: ...e By dragging your finger over a table or diagram you can pan the displayed area of the table or diagram to show results that were previously out of view Figure 7 4 Dragging Pinching and spreading two...

Страница 100: ...e corresponding mea surement settings are adapted This is different to selecting an area on the screen in zoom mode where merely the resolution of the displayed trace points is changed temporarily gra...

Страница 101: ...ce level is locked and thus not changed automatically due to touch gestures See Chapter 7 2 1 Toolbar on page 89 and the R S FSV A User Manual Mouse vs touch actions Any user interface elements that r...

Страница 102: ...ifferent ways both graphically and numerically For each evaluation method the results are dis played in a separate window in the tab The R S FSV A allows you to configure the display to suit your spec...

Страница 103: ...New Chan nel tab A new tab is displayed for the new channel To change the application in an active channel 1 Select the tab of the channel you want to change 2 Select the Mode key 3 In the Mode dialo...

Страница 104: ...ayout possibilities The SmartGrid functionality provides the fol lowing basic features Windows can be arranged in columns or in rows or in a combination of both Windows can be arranged in up to four r...

Страница 105: ...Different colors and frames indicate the possible new positions The position in the Smart Grid where you drop the window determines its position on the screen Figure 7 7 Moving a window in SmartGrid...

Страница 106: ...w the existing row if the maximum of 4 has not yet been reached 1 1 2 2 2 3 3 A B C Figure 7 8 SmartGrid window positions 1 Insert row above or below the existing row 2 Create a new column in the exis...

Страница 107: ...o 16 individual windows can be displayed per channel i e per tab 1 Activate SmartGrid mode All evaluation methods available for the currently selected measurement are displayed as icons in the evaluat...

Страница 108: ...will be placed 3 Move the window until a suitable area is indicated in blue 4 Drop the window in the target area The windows are rearranged to the selected layout and Delete and Move icons are display...

Страница 109: ...lts displaying several windows at the same time may be helpful However the individual windows may become rather small In this case it is useful to maximize an individual window to the entire screen te...

Страница 110: ...ing the touch sensitivity of the screen Zooming into the diagram 7 6 Getting Help If any questions or problems concerning the R S FSV A arise an extensive online help system is provided on the instrum...

Страница 111: ...al topic or the Con tent tab is displayed For standard Windows dialog boxes e g File Properties Print dialog etc no context sensitive help is available To display a help topic for a screen element not...

Страница 112: ...arz product contact our customer support center A team of highly qualified engineers provides support and works with you to find a solution to your query on any aspect of the operation program ming or...

Страница 113: ...ns 86 Compatible mode channel setting 82 Connector AC power supply 47 Aux Port 49 50 Display Port 47 DVI 47 External mixer 44 GPIB interface 48 IF Video DEMOD 49 LAN 47 Noise Source Control 48 OCXO 50...

Страница 114: ...bar 83 Getting started 12 GPIB interface Configuring see user manual 48 Connector 48 Graphical zoom 100 H Hard drive Removable 41 Hardcopy see Screenshots 76 Headphones Connector 44 Help 110 Hiding S...

Страница 115: ...lay 54 Options Secure user mode K33 32 Overheating Shutdown 21 P Pa channel bar 83 Parameters Entering 95 96 Passwords Secure user mode 34 Peak list Trying out 65 PHN marker functions 86 Phones Connec...

Страница 116: ...Split Window 109 Split display 37 Splitters Window size 108 Star yellow see Invalid data icon 81 Status bar Color coding 88 Error messages 87 Secure user mode 33 Status display 86 Switching Focus are...

Страница 117: ...ng 108 Closing 107 Dialog boxes 95 Size 108 Windows 10 Access 25 Y Yellow star see Invalid data icon 81 YIG Bypass channel bar 83 Z Zoom Graphical 100 Measurement 100 Zooming see User Manual 110 Tryin...

Отзывы: