


PGA-710 Autoanalysis System – How To Measure Guide
32
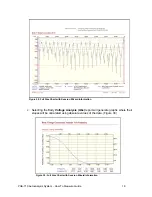
Figure 58: A Full Size Landscape Chart in the “Assembled” Format
X. Assembled Decay Charts
In the “assembled” format, all decay cycles are compared to each other regardless of how
long it required generating the entire test series.
In effect, the test set is “taken apart” by each test cycle and reassembled in sequence. The
Positive cycles are compared to the Negative cycles as shown in Figure 58. For example,
the total decay time of all Positive cycles was slightly more than 4.8 seconds, while the total
of all Negative cycles is approximately 5.7 seconds.
Rev: PGA-710 – 1-2011
Format modification: 02-11-2005
NOTE
For additional information, review the PGA-710
Operations Manual and industry test standards.