


PGA-710 Autoanalysis System – How To Measure Guide
17
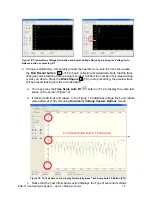
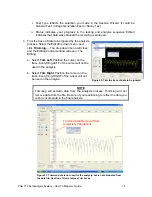
Figure 27: Automatically Calculated
Standing & Walking Voltage Ranges
Figure 28: Generating Reports using Document Drop Down Menu
In this illustration, the Blue Lines Indicate Standing
Body Voltage Average ±3 Standard Deviations
In this illustration, Red Lines Indicate Walking Body
Voltage Average ±3 Standard Deviations
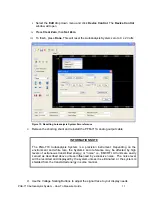
8.
Once the basic calculations are completed a detailed report may be generated. From the
Document
drop down menu (Figure 28) select
Report View
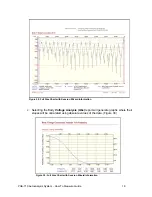
a.
This opens the Report window where type and format may be selected.
b.
If the
Body Voltage Test
is selected, a full size 8.5 x 11.0 inch landscape chart will
be generated for printing, or export (Figure 29). Any information entered in the
Session Wizard will be included on the chart.