PicoVNA 106 6 GHz Vector Network Analyzer
27
© 2017 Pico Technology
pv106ug r1
6
Operation
The PicoVNA 2 software allows you to program the measurement parameters and plots the measurement
results in real time. The main window includes a status panel that displays information including calibration
status, frequency sweep step size and sweep status. The
Help
menu includes a copy of this manual.
6.1
The PicoVNA 2 main window
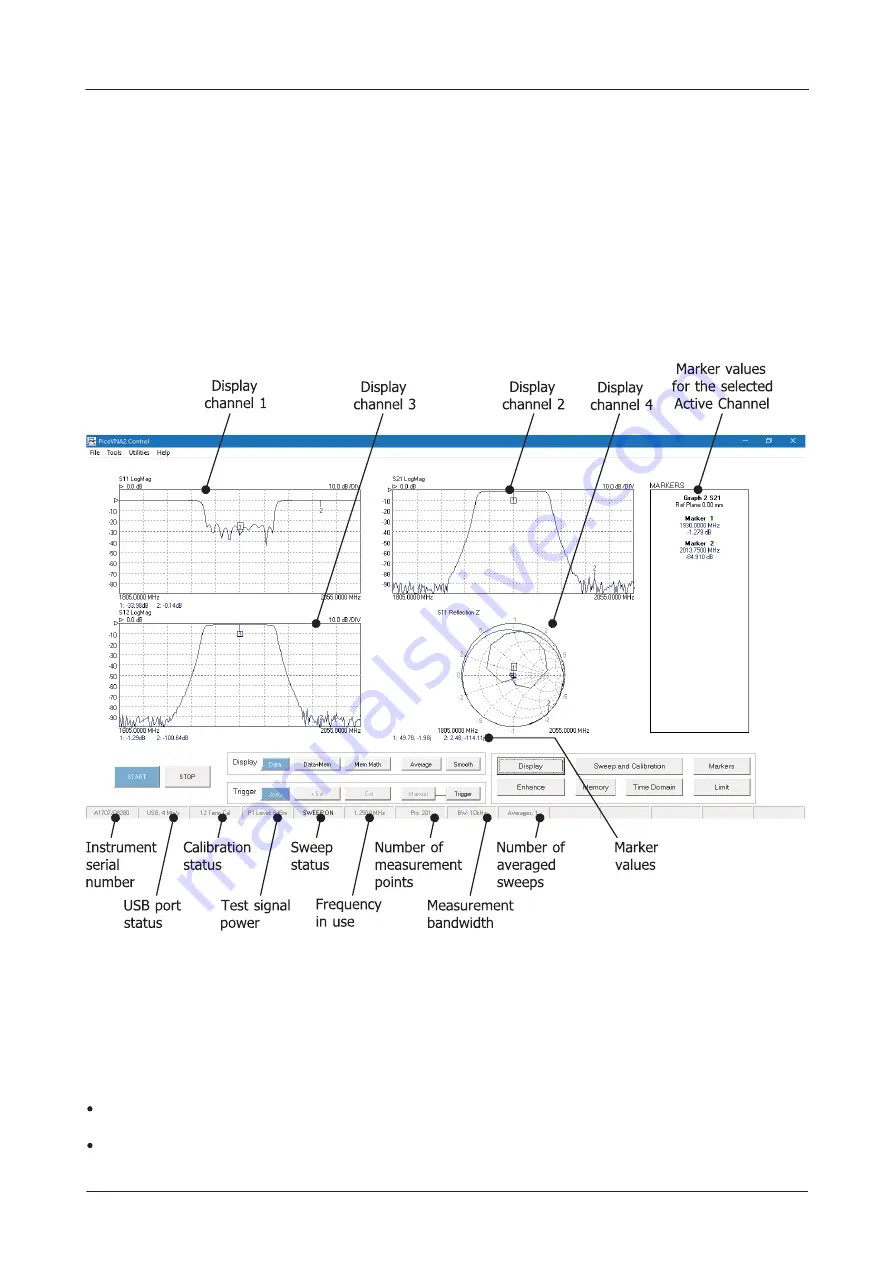
The PicoVNA 2 main window is shown below. It is dominated by a large graphics area where the
measurement results are plotted together with the readout of the markers. One, two or four plots can be
displayed simultaneously. The plots can be configured to display the desired measurements.
User interface window
6.1.1
Display setup
Setting up the display is carried out through the
Display Set Up
window which is called up from the main
window by clicking
Display
. The window is shown below. The typical sequence to set up the display is as
follows:
Set the number of channels to be displayed by clicking the appropriate radio button under
Display
Channels
Select the desired active channel from the drop-down list (can also be selected by clicking on a marker in
the main window on the desired display channel)


