© PCE Instruments
7
6.5
Zoom into graph
If you have recorded measurements over a long period of time, it can be difficult to analyse the
readings accurately. In order to analyse a specific period of time, it is helpful to display this specific
range. For this purpose, there is the "Zoom in" function. To use this, click on "Zoom in" and mark
the area you want to analyse more precisely. The marked area is enlarged immediately.
6.5.1
Move graph
To move the graph now, click on "Move". You can now move the graph within the X- and Y-axes.
6.5.2
Normal view
To return from zoom view to normal view, click once on "View all".
6.6
Print graph
To print the displayed graph, click on "Print". Now you can print the graph.
Important:
The
current view is always printed. This means that if you have zoomed into the graph,
only the zoomed part will be printed.
6.7
Export and import data
To export the measurement data, click on "Save As". From here, you can save the measurement
data to another storage medium or directly to your PC.
To import the measurement data again, click on "Open". From here, select the measurement
data.
6.8
Generate CSV file
To generate a CSV file of the measured values, first click on "File". Then click on "Export to Excel".
From here, select the storage location.
6.9
Further settings for the graphical view
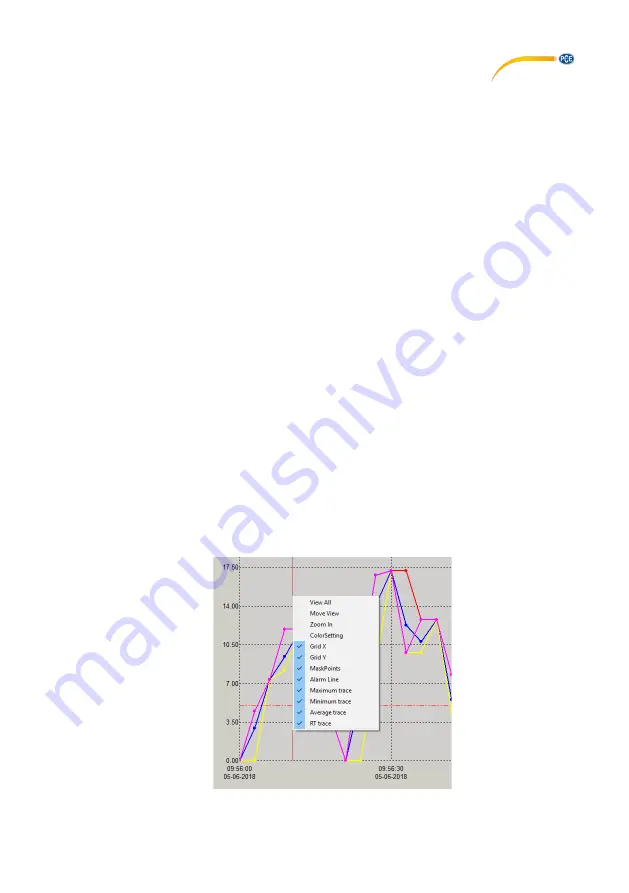
By right-clicking on the graph, you can view further setting options for the graphical view.


