


Using the Colorimeter with DataStudio
By default, when you plug a Colorimeter into a PASPORT interface and click
the
Start
button, DataStudio automatically displays the percent
transmittance readings for each of the four colors (red, green, blue, orange)
in a Graph display. Any time you need to change the Colorimeter’s settings
to read a different measurement, you must use the PASPORT Setup
window in DataStudio. To open the PASPORT Setup window, click the
button on the main toolbar. Then click to place an “X” next to the
desired measurement. To remove the setting, click on the “X” again.
Example
: You want the Colorimeter to read absorbance instead of %
transmittance for all four colors. In the boxes next to the colors with the
“transmittance” unit, click to remove the “X.” Then click to place an “X” in
each of the boxes next to the colors with the “Absorbance” unit.
1. Plug the Colorimeter into the PASPORT interface. When the
PASPORTAL window opens, select “Launch EZ-SCREEN.”
2. To begin collecting data, click the
Start/Stop
button.
3. To end data collection, click the
Start/Stop
button.
4. To cycle through the different colors and measurement types, click
the
Colorimeter icon
in the bottom right corner of the screen.
5. To toggle between separate runs of data, click the
Toggle
button.
Note:
To simultaneously view all colors in one graph, you must use either
DataStudio or DataStudio Lite.
Note:
Colorimeter options appear in the Setup window when you connect
a Colorimeter to a USB link. To view all Colorimeter measurement options,
use the
Maximize
button in the Setup window.
Using the Colorimeter with Xplorer
1. Turn on the Xplorer.
2. Plug the Colorimeter into the Xplorer. (Note: If you wish to perform
calibration, you must have Xplorer connected to your computer. Use
the procedure described on the reverse of this card.)
3. To collect data, click the
Start
button. The LED light flashes
when Xplorer is storing data. (To stop, click the Start button again.)
4. To cycle through the measurements (transmittance or absorbance) for
each color, click the
Plus
button (to more forward) or
Minus
button (to
move backward.)
5. To view your data in DataStudio, connect the Xplorer cable to the USB
port on your computer and to the USB port on the side of Xplorer.
6. At the DataStudio prompt, click
Retrieve Now
. DataStudio
automatically displays the % transmittance readings for the four
colors.
Note:
To view absorbance readings in DataStudio, you must open the Setup
window and change the settings. See “Using the Colorimeter with DataStudio”
on this card.
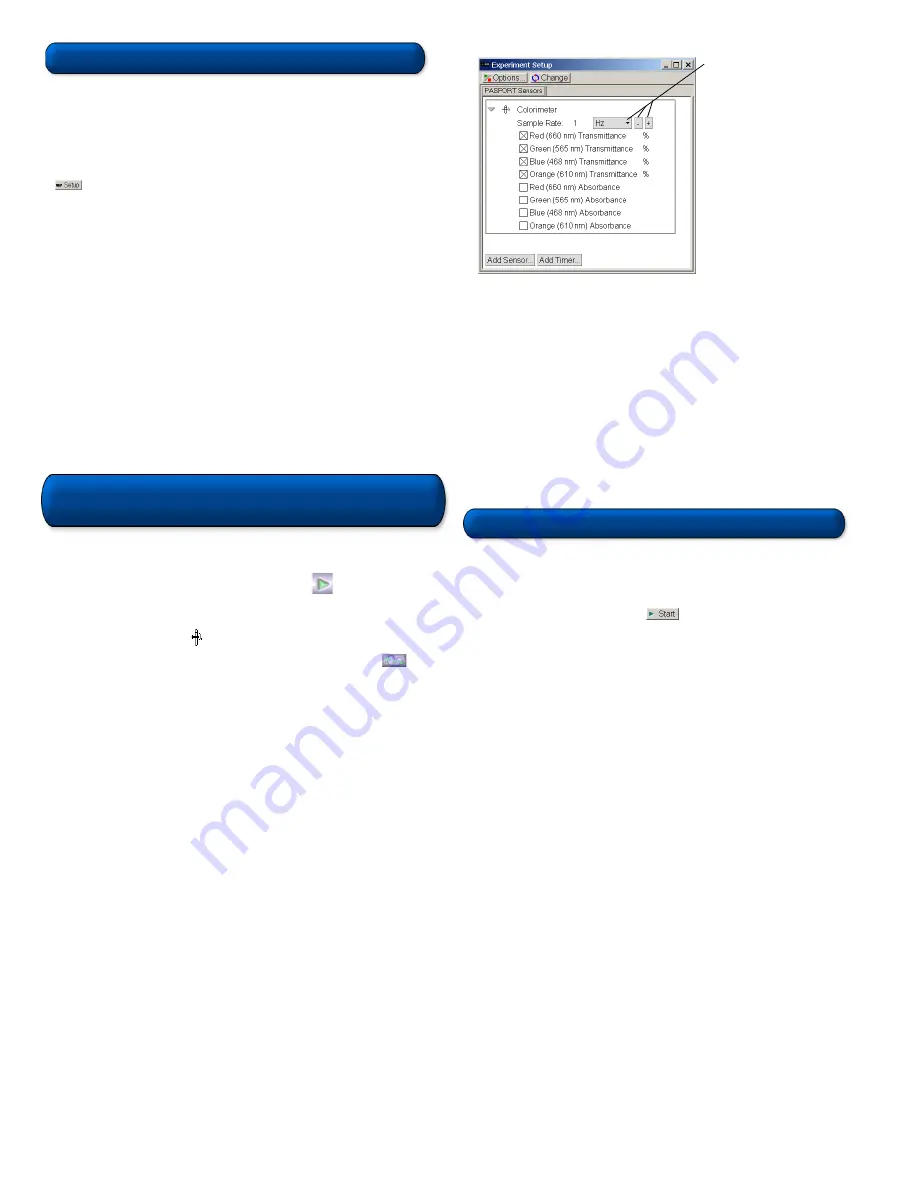
Using the Colorimeter with the
PASPORT EZscreen
Use the down
arrow and the
Plus
and
Minus
buttons
to change the
sample rate.
012-08158C
CARD 4A
CARD 4B


