13
The Business of Science
®
•
•
•
E1000 Curve Programmer
E1000 Curve Programmer
E1000 Curve Programmer
E1000 Curve Programmer
To enter data for a user defined diode curve, the E1000
E1000
E1000
E1000 Curve Programmer
Curve Programmer
Curve Programmer
Curve Programmer can be used. This utility allows
the user to enter the polynomial coefficients that control the voltage to temperature conversion.
In order to determine appropriate values, several “Voltage vs. Temperature” data points should be viewed
in graph form. The graph can be broken up piece-wise into a maximum of 3 equations. For each of the
equations, a trend line should be developed using a program such as Microsoft Excel or Matlab. Up to a 6
th
order polynomial can be used for each equation to provide maximum flexibility.
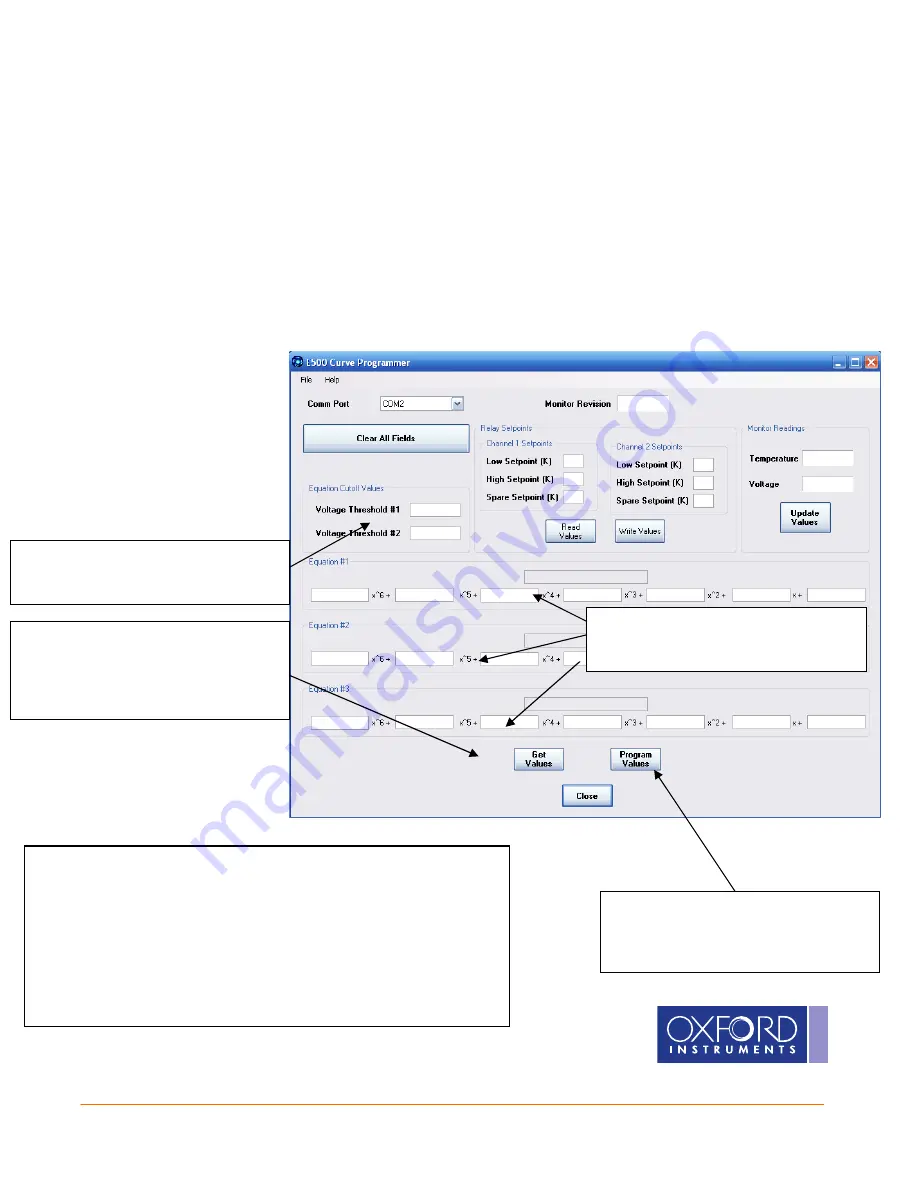
Once the values have been chosen, the fields shown below should be populated.
Set the 2 voltages values that
determine the boundaries of the 3
equations.
Set all coefficient values for all 3
equations. Please ensure that each
text box is populated.
Begin by pressing “Get Values” at the
bottom of the screen. This will ensure
that communications are established.
If successful, the “Monitor Revision”
will be available.
Once all fields are populated, press
“Program Values” to permanently
program the new coefficients to the
CUSTOM curve.
An advanced feature is also provided to allow the user to write the
coefficients and setpoints to a file from the E1000 Temperature
Monitor. Select “File -> Write Values to File…” and browse to a file
location. This will create a user editable text file with the coefficients
and setpoints. Updates can be made to the file to change values,
and then downloaded back to the E1000 Monitor by selecting “File ->
Program Values From File…”.