


© 2 Save Energy plc 31/03/2009
Page 23 of 36
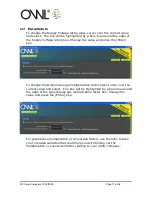
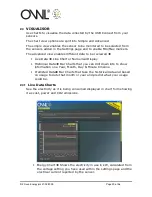
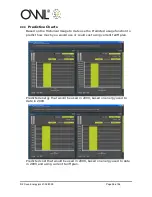
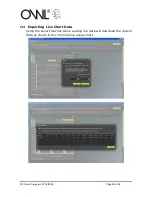
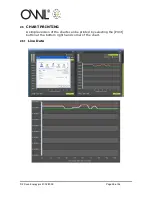
2.4.3
Historical Data Charts
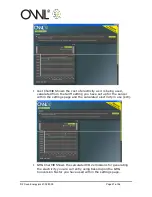
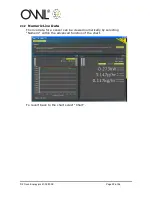
The collected data for a sensor can be viewed by un-checking the live
usage box within the advanced function of the chart.
This will take you into the top level of the data shown as data used on a
yearly timeline.
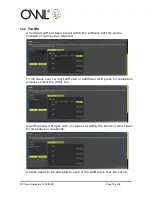
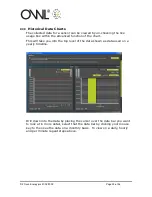
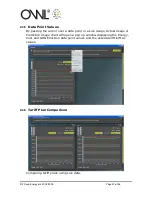
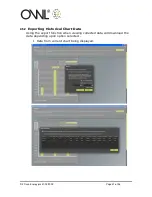
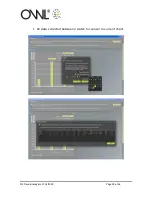
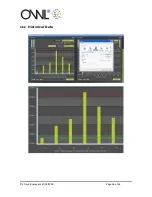
Drill down into the data by placing the cursor over the data bar you want
to look at in more detail, select that the data bar by clicking your mouse
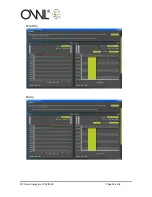
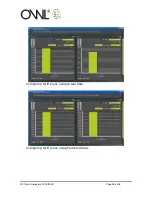
key to then see the data on a monthly basis. To view on a daily, hourly
and per minute repeat steps above.
Содержание USB CONNECT
Страница 1: ... 2 Save Energy plc 31 03 2009 Page 1 of 36 OWL USB CONNECT USER GUIDE ...
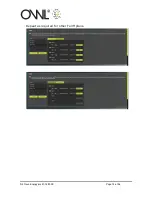
Страница 14: ... 2 Save Energy plc 31 03 2009 Page 14 of 36 Repeat as required for other Tariff plans ...
Страница 16: ... 2 Save Energy plc 31 03 2009 Page 16 of 36 Select the appropriate plan to be associated to that sensor ...
Страница 24: ... 2 Save Energy plc 31 03 2009 Page 24 of 36 Monthly Daily ...
Страница 25: ... 2 Save Energy plc 31 03 2009 Page 25 of 36 Hourly Per Minute ...
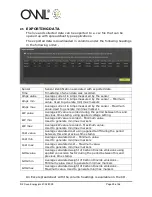
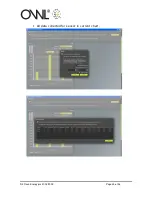
Страница 32: ... 2 Save Energy plc 31 03 2009 Page 32 of 36 All data collected between 2 dates for sensor in current chart ...
Страница 33: ... 2 Save Energy plc 31 03 2009 Page 33 of 36 All data collected for sensor in current chart ...
Страница 36: ... 2 Save Energy plc 31 03 2009 Page 36 of 36 2 6 2 Historical Data ...


