


© 2 Save Energy plc 31/03/2009
Page 20 of 36
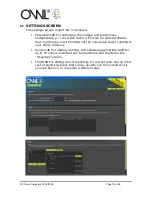
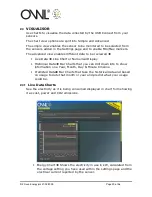
2.4
VISUALISOR
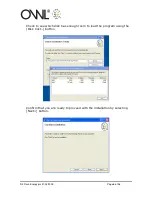
Use charts to visualise the data collected by the USB Connect from your
sensors.
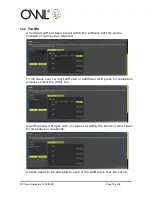
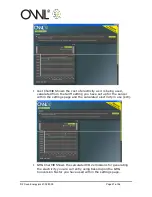
The chart view options are split into Simple and Advanced.
The simple view enables the sensor to be monitored to be selected from
the sensors added in the Settings page and to enable Min/Max markers.
The advanced view enables different data to be reviewed
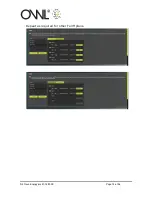
•
Live Data
Line Chart or Numerical Display
•
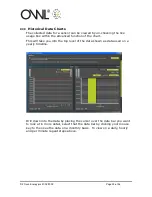
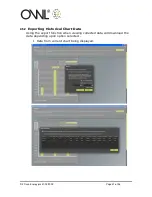
Historical Data
Bar Charts that you can drill down into to show
information on a Year, Month, Day & Minute timeline
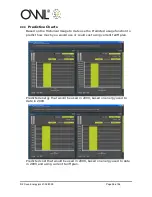
•
Predicted Data
Bar Charts that take the historical data and based
on usage to date that month or year and predict what your usage
could be.
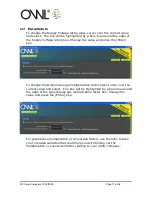
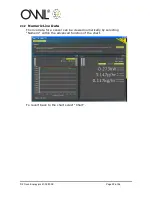
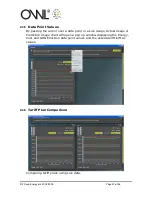
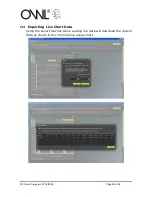
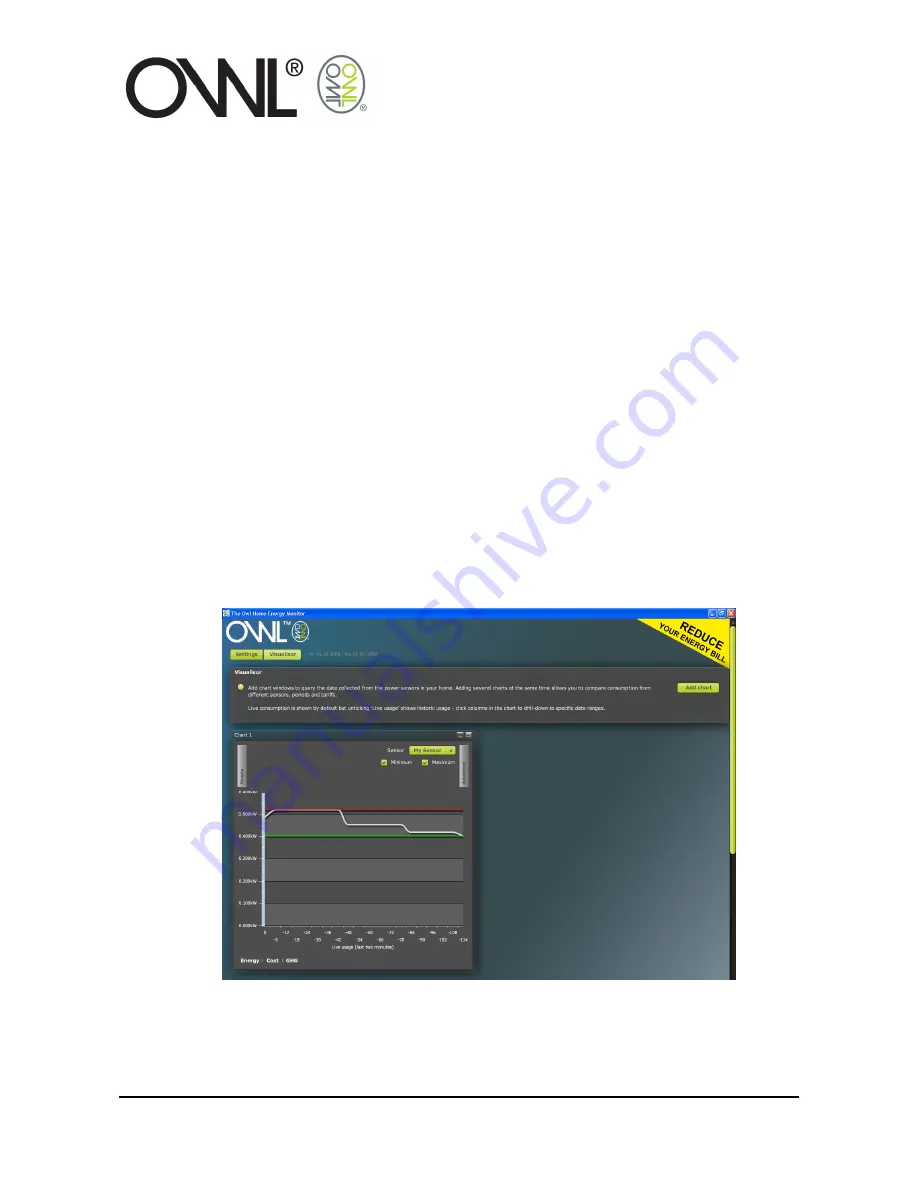
2.4.1
Live Data Charts
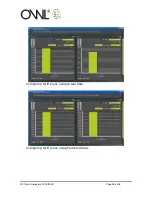
See the electricity as it is being consumed displayed in chart form showing
it as cost, power and CO2 emissions.
•
Energy Chart
Shows the electricity in use in kW, calculated from
the voltage setting you have used within the settings page and the
electrical current reported by the sensor.
Содержание USB CONNECT
Страница 1: ... 2 Save Energy plc 31 03 2009 Page 1 of 36 OWL USB CONNECT USER GUIDE ...
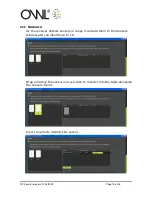
Страница 14: ... 2 Save Energy plc 31 03 2009 Page 14 of 36 Repeat as required for other Tariff plans ...
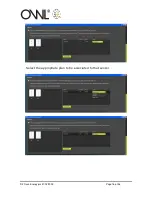
Страница 16: ... 2 Save Energy plc 31 03 2009 Page 16 of 36 Select the appropriate plan to be associated to that sensor ...
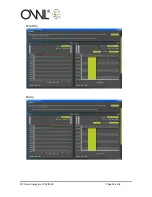
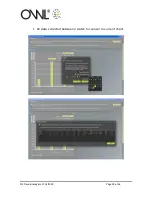
Страница 24: ... 2 Save Energy plc 31 03 2009 Page 24 of 36 Monthly Daily ...
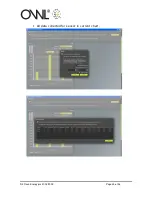
Страница 25: ... 2 Save Energy plc 31 03 2009 Page 25 of 36 Hourly Per Minute ...
Страница 32: ... 2 Save Energy plc 31 03 2009 Page 32 of 36 All data collected between 2 dates for sensor in current chart ...
Страница 33: ... 2 Save Energy plc 31 03 2009 Page 33 of 36 All data collected for sensor in current chart ...
Страница 36: ... 2 Save Energy plc 31 03 2009 Page 36 of 36 2 6 2 Historical Data ...


