


AC Voltage Data Logger
7
5.
The enclosed area of the box will now be zoomed so that it fills the entire
window. This may be repeated if additional magnification of an area of the
graph is desired.
6.
To return to the original graph with no
auto scaling, click on the
Full Graph
button.
7.
To auto-scale the
graph, click on the Auto
Scale button. The graph
will automatically be
readjusted to fill the vertical axis of the screen.
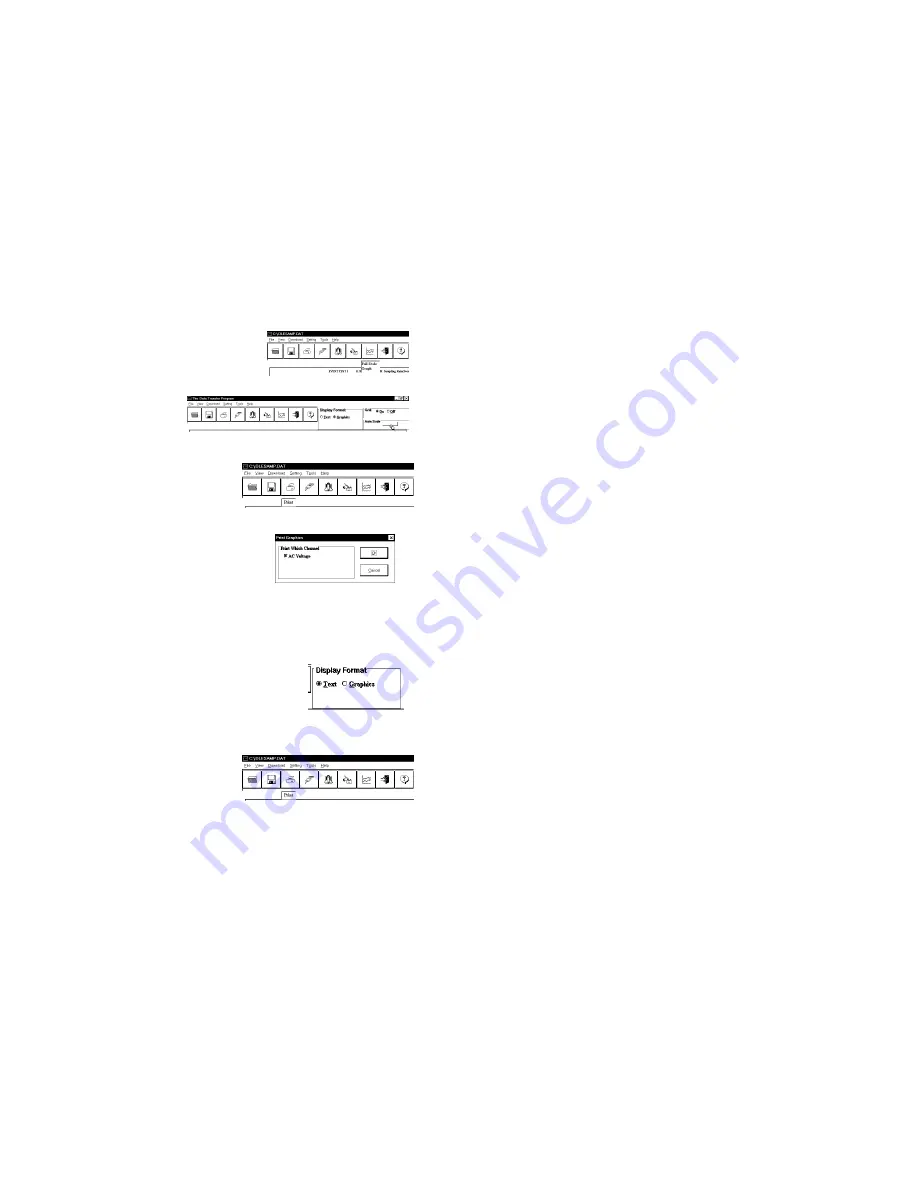
8.
The graph on the screen may be
printed at any time by clicking on
the
button. Note that the
printout will be what is displayed on
the screen when the button is clicked.
9.
A prompt window will open in the middle of
the screen. Click
OK
to print, or
Cancel
if
you change your mind.
V
IEW A
R
ECORDING AS
T
EXT
1.
When a recording is retrieved, or when a saved recording is opened, it is
displayed in the most recently used mode. The recording can be viewed as
a text listing or a plotted graph.
2.
To view a recording as text when a graph is on the
screen click the
Text
button located in the display
box.
3.
Use the Windows™ scroll bar on the right hand
side of the screen to scroll through the text information
4.
To print the text information as text
data, click on the
button. A
window will open in the middle of
the screen. In the lower left of the
window will be a drop-down
menu which will allow you to select the number of volts the AC voltage has
to change before the new value is printed. This feature will prevent needless
printing of the AC voltage when no change in the voltage has occurred. If
you wish to print all the recorded information, leave this value at zero.
Содержание OM-DLAV
Страница 1: ...AC Voltage Data Logger 1...