}
3.2
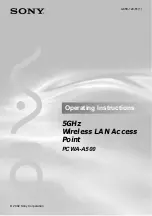
Interface Status
On the
Start
>
Interface Status
page, you can view the current status of all physical
interface, including the type of interface, connection type, status, IP address, duration
and so on.
Figure 3-5 Interface Status
3.3
Interface Traffic
The interface rate chart dynamically displays the real-time RX/TX rate, average
RX/TX rate, maximum RX/TX rate and total RX/TX traffic of each physical interface. If
you want to view the rate chart of an interface, click the corresponding interface name
hyperlink.
In the interface rate chart, the abscissa (x-axis) shows the time axis, and the ordinate
(y-axis) shows the real-time RX/TX rate axis. Furthermore, you can adjust some
parameters of the chart if needed, such as the time interval during which the real-time
rates are calculated and displayed, and the displayed colors.
Note:
The rate chart can only show the rate and traffic information in the last ten
minutes. Each time you launch this page, the rate chart refreshes.