


Navini Networks, Inc.
Ripwave-MX Modem User Guide
Troubleshooting Using
Navini Diganostics
(NavDiag), continued
The Signal Quality bar area graphically represents the Signal-to-
Noise Ratio (SNR) of the downlink access code channel (ACC)
received by the Modem. Again, the quality of the signal is
represented by a group of colored bars. The higher the pile of
goes, the better the SN
bars
R of the signal. The color of the bars also
ives an indication of the quality of the signal. Green lines indicate
n
a good signal while red
nes indicate a weak signal.
o increase the strength and quality of the signal, change the
cation of the LMX Modem. Try moving it closer to a window, to
le
is repositioned, observe the Signal
trength and Signal Quality bars. Position the Modem for
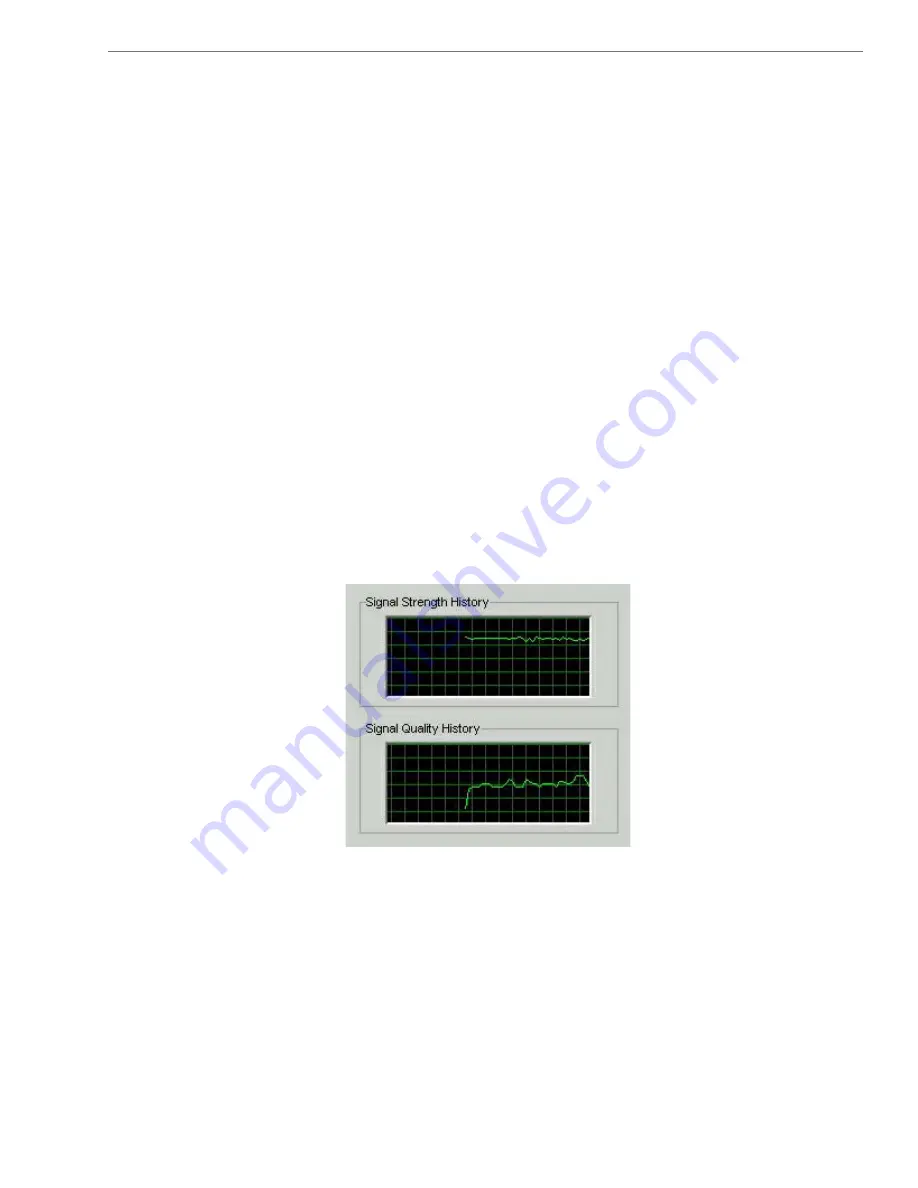
he History graphs plot the change in signal strength and signal
uality over time. The graphs cover the last minute and are updated
very second. Read the graphs from right to left. The right side of
t
of the Connection Status screen, are four parameters.
hese parameters are BTS ID, Network ID, Active SW Version,
nd Standby SW Version. The BTS ID and Network ID indicate
e BTS to which the Modem is currently synchronized and the
etwork in which the Modem is operating. Active SW Version and
tandby SW Version indicate the version number of the software
urrently loaded in the “active side” and “standby side” of the
odem’s flash memory.
g
a excellent signal. Orange lines indicate
li
T
lo
a higher location, away from other wireless devices (microwave
ovens, cordless phones), and away from metal objects (shelves, fi
cabinets). As the LMX Modem
S
maximum signal strength and quality.
T
q
e
the graph represents the most recent status of your Modem.
A the bottom
T
a
th
n
S
c
M
19
050801_pv1.5_Ripwave-MX Modem User Guide_40-00097-00j(4.3.1)


