


Chapter 11
Loops and Charts
©
National Instruments Corporation
11-17
Activity 11-6. Create a Multiplot Chart and
Customize Your Trends
Your objective is to create a chart that can accommodate more than
one plot.
Front Panel
1.
Open the
Random Average.vi
you created in Activity 11-5.
2.
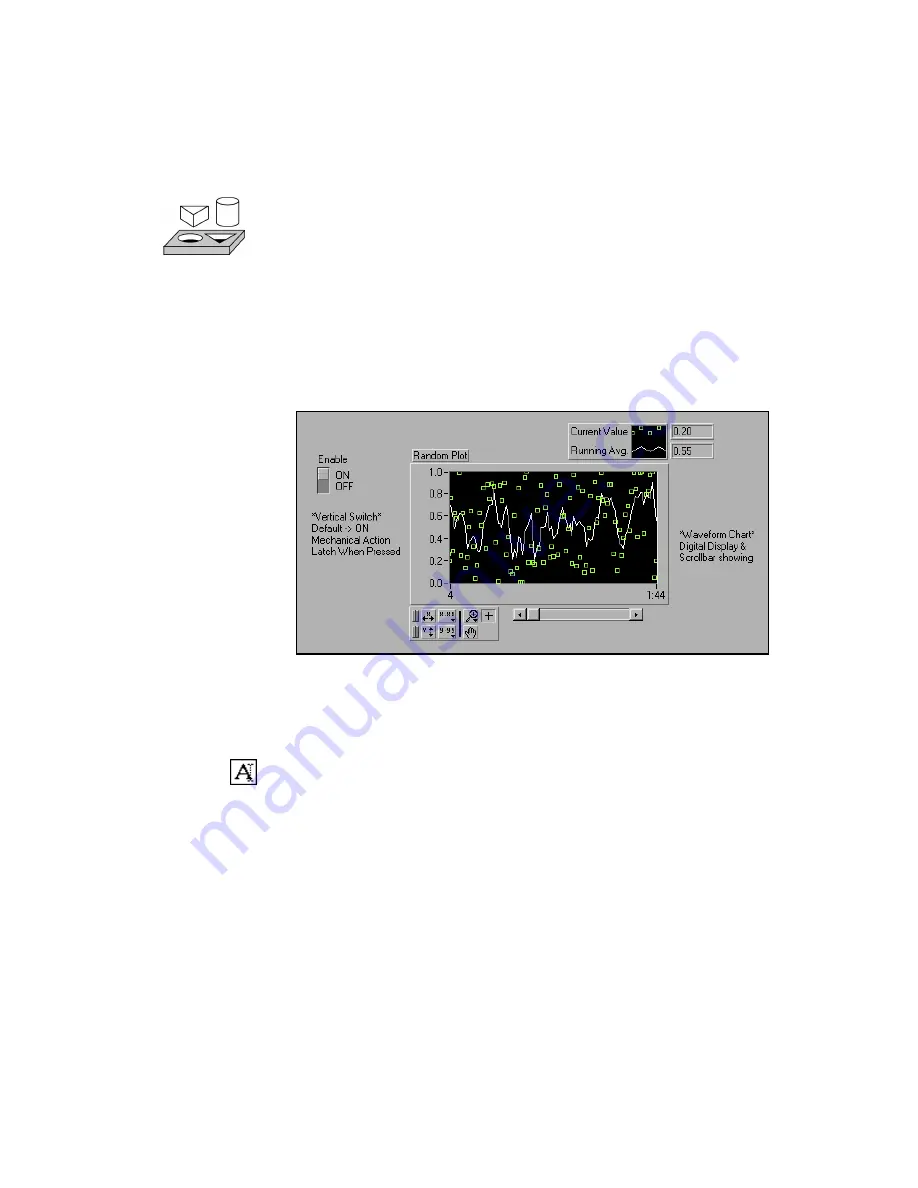
Modify the Front Panel as shown in the following illustration.
a.
Using the Positioning tool, stretch the legend to include two plots.
b.
Show the digital display by popping up on the chart, and choosing
Show»Digital Display. Move the legend if necessary.
c.
Rename Plot 0 to
Current Value
by double-clicking on the
label with the Labeling tool and typing in the new text. You can
resize the label area by dragging either of the left corners with
the Positioning tool. Rename Plot 1 to
Running Avg
in the
same way.
d.
For the
Current Value
plot, change the interpolation to
unconnected, the point style to square, and the color to green. You
can change the plot style and color by popping up on the legend.


