PAC1921 High-Side Current/Power Sensor Evaluation Board User’s Guide
DS50002376A-page 34
2015 Microchip Technology Inc.
4.3
TAB DESCRIPTIONS
4.3.1
Vbus & Vsense Tab
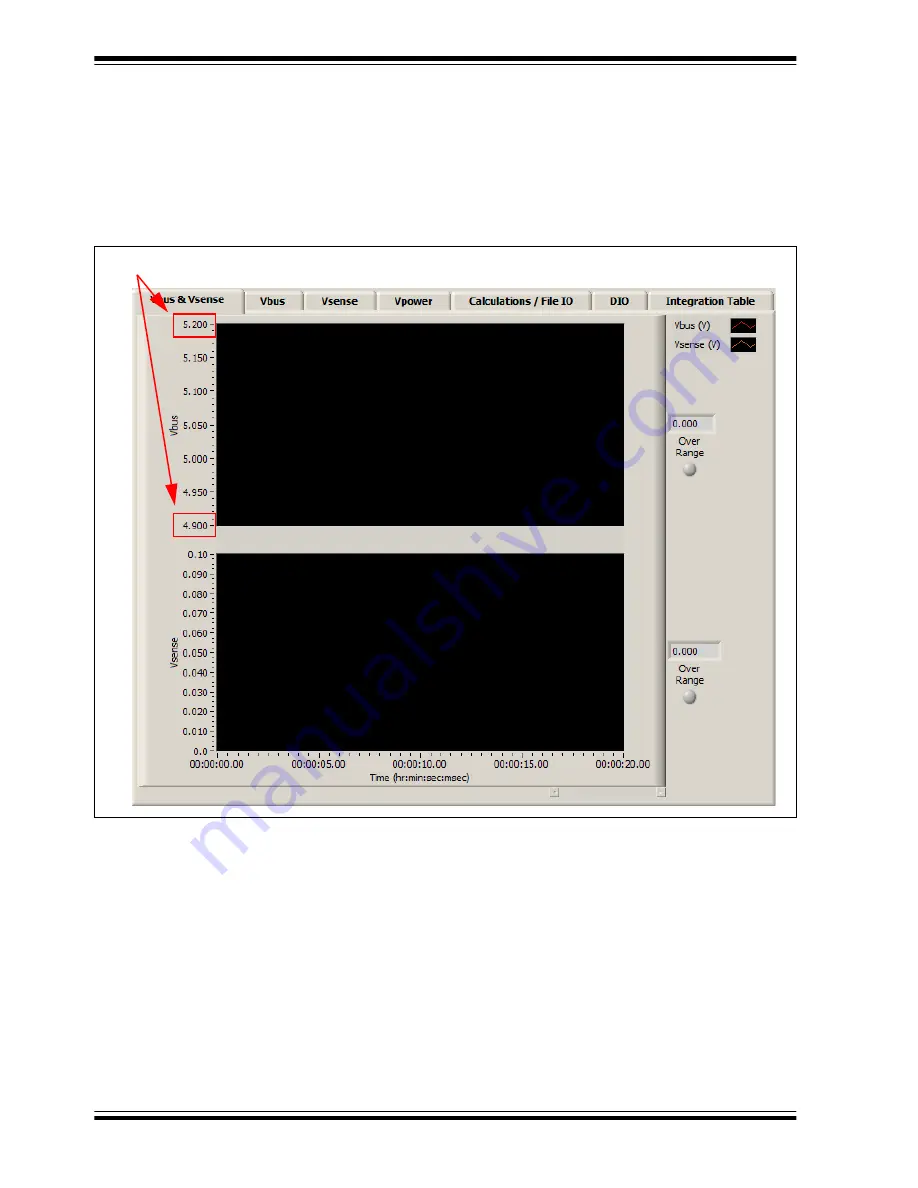
The
Vbus & Vsense
, displays plots for calculated V
BUS
in
volts and calculated V
SENSE
in volts. The plots are not self-scaling. If the value in the
box at the right of the plot (indicated with arrows) falls outside the Y-axis range on the
plot, click the top and/or bottom value on the axis and type in a new value.
FIGURE 4-13:
Vbus & Vsense Tab.
Click to enter new values to scale the plot.


