background image

MI 2130 VoltScanner                                                           

Setting Up the VoltScanner 


11 

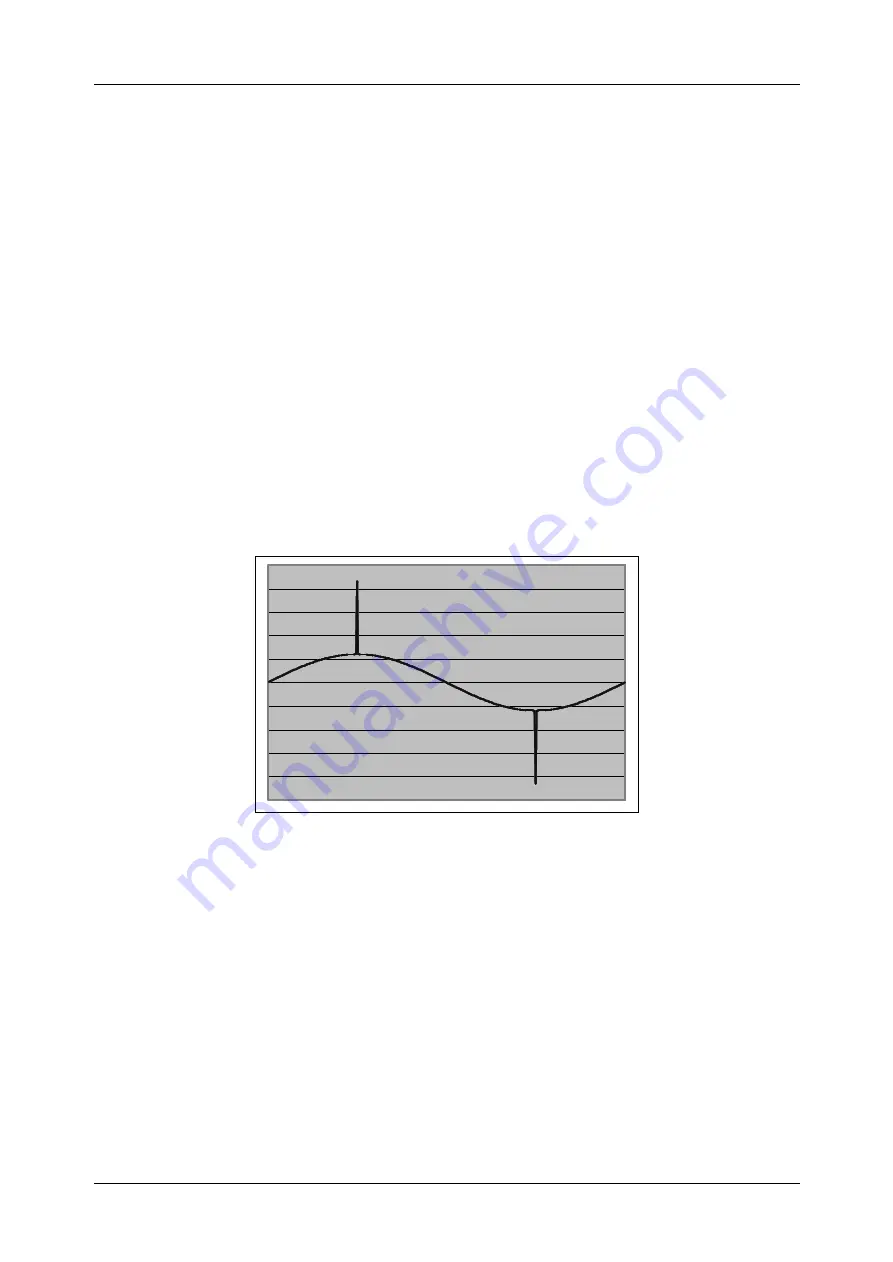
Voltage Transient 

A  voltage  transient  is  a  short  duration  overvoltage  which  lasts  a  few  milliseconds  or 
less.  The  VoltScanner  records  transients  both  on  L-N  and  N-PE  inputs,  which  are 
above  the  set  threshold  and  last  at  least  1us.  It  records  magnitude  and  phase  of  a 
transient.  If  there  are  more  transients  in  one  half  cycle,  the  VoltScanner  records 
magnitude  and  phase  of  the  highest  transient  and  the  number  of  transients  that 
occured.  
Transients  are  usually  caused  by  lightning,  electrostatic  discharges,  load  switching  or 
faulty wiring. Transients can erase or alter computer data and, in extreme cases, they 
can  even  destroy  electronic  circuitry  and  damage  the  electrical  equipment.  Generally 
speaking, transients can be classified into two categories: 
  

• 

An impulsive


transient is a sudden, non-power frequency change in the steady state 

condition  of  voltage,  which  is  unidirectional  in  polarity  (either  positive  or  negative). 
The most common cause of impulsive transients is lightning. They are generally not 
conducted far from the source of where they enter the power system, although they 
may, in some cases, be conducted for quite some distance along utility lines. 

• 

An oscillatory transient is a sudden, non-power frequency change in the steady state 
condition of voltage which includes both positive and negative polarity values. 


   Impulsive Transient 


Frequency Variations 

Frequency  Variations  are  defined  as  a  deviation  of  the  power  system  fundamental 
frequency from its specified nominal value (e.g. 50 Hz or 60 Hz).  
The power system frequency is directly related to the rotational speed of the generators 
supplying  the  system.  There  are  slight  variations  in  frequency  when  the  dynamic 
balance  between  load  and  generator  changes.  The  size  of  the  frequency  shift  and  its 
duration depends on the load characteristics and the response of the generation control 
system to load changes. 
Frequency  variations  that  go  outside  the  accepted  limits  for  normal  steady  state 
operation of the power system can be caused by faults on the bulk power transmission 
system, a large block of load being disconnected, or a large source of generation going 
off- line.  
The VoltScanner records frequency events whether the frequency goes above or  

Содержание VoltScanner MI 2130

Страница 1: ...VoltScanner MI 2130 User Manual Version 3 0 Code No 20 750 703...

Страница 2: ...meets the requirements of the EU European Union concerning safety and interference causing equipment regulations 2000 METREL No part of this publication may be reproduced or utilized in any form or b...

Страница 3: ...anguage 7 2 3 Sending Parameters to the VoltScanner 7 2 3 1 Selecting a COM Port 7 2 3 2 Setting the Instrument Type 8 2 3 3 Setting the Thresholds 8 2 3 4 Sending the Parameters 13 3 Plugging in the...

Страница 4: ...Applied standards Instrument operation EN 50160 Safety EN 61010 1 EMC emission EN 50081 1 EMC immunity EN 50082 2 1 3 Warnings In order to reach the highest level of operator s safety it is necessary...

Страница 5: ...ble 3 1 5 m with 3 pcs safety test tips Order No S 1112 Set of Alligator clips black 3 pcs Order No S 2010 1 5 PC Hardware Requirements Pentium processor based computer with Windows 95 98 or 2000 NT X...

Страница 6: ...regulations Cleaning To clean the surface of an instrument use a soft cloth slightly moistened with soapy water or alcohol Then leave the instrument to dry totally before use Do not use liquids based...

Страница 7: ...hoose Language option It enables you to select one of the available languages You should restart the ScanLink program to apply the selected language 2 3 Sending Parameters to the VoltScanner VoltScann...

Страница 8: ...or the first time you should select Instrument type Go to Config menu and choose Instrument type option The following Instrument Settings window will open 2 3 3 Setting the Thresholds Click the Settin...

Страница 9: ...ltScanner to operate Event and Transient mode In this mode the VoltScanner records single events that fall above or below the set thresholds Event Transient section has three subsections Line to Neutr...

Страница 10: ...lls The next picture shows a short voltage swell lasting only two cycles Voltage Swell Voltage Dip A voltage dip is a decrease in line voltage that can last for an indefinite period The VoltScanner re...

Страница 11: ...ey are generally not conducted far from the source of where they enter the power system although they may in some cases be conducted for quite some distance along utility lines An oscillatory transien...

Страница 12: ...n this mode the VoltScanner records the mean values of the supply voltage over a given sampling interval It also records the minimum and maximum cycle during each sampling interval This sampling inter...

Страница 13: ...he Save as Default button you can save the parameters which are currently in the Instrument Settings window as your default parameters Note that the factory installed settings are erased once you save...

Страница 14: ...alog box will appear Click the OK button to clear the message The VoltScanner starts to record immediately after the communication has been successfully completed If not Click the OK button to clear t...

Страница 15: ...e VoltScanner will measure Line to Ground voltage instead of Neutral to Ground voltage This LED also indicates the presence of a line voltage at least 90Vrms in an outlet Event indicates if any events...

Страница 16: ...for at least 5 hours or over night before using it again If you don t plan to use the VoltScanner for a longer period of time you can always leave it plugged into the nearest outlet no need to be set...

Страница 17: ...that once you download the data the VoltScanner is not set and will not record any data until new parameters are sent Downloading can last up to 40 seconds Baud Rate 9600 if memory is full When downl...

Страница 18: ...ndard also requires that the sampling interval lasts 10 minutes but the software performs the same analysis if sampling interval is different Before the analysis is performed you must select the prope...

Страница 19: ...4 2 Periodics graphs By clicking the Graph button you can view Voltage Time graph with all three voltage values average MIN and MAX If EN 50160 analysis was performed before drawing the graph the grap...

Страница 20: ...MI 2130 VoltScanner Downloading and Analysing Data 20 Zoom in graph...

Страница 21: ...displayed in hours minutes and seconds if it is longer than 12h it is displayed with date and time when the event ended If event is transient the phase of the highest transient is displayed Magnitude...

Страница 22: ...oftware performs frequency analysis according to the EN 50160 standard which requires 99 5 of the mean values measured over 10 seconds must be within the range 1 of the nominal frequency This analysis...

Страница 23: ...50160 Data Graph This graph displays the number of swell dip transient frequency and interruption events in a bar graph You can select to view all data or just a specific time frame which you define...

Страница 24: ...subperiods For instance if you select three subperiods each type of event will be represented with three bars in the graph first bar representing events that occurred between 00 00 and 08 00 second ba...

Страница 25: ...urs the VoltScanner stays active for the next 3 5 minutes and continues measuring and recording events This is very convenient if an interruption is shorter than 3 5 minutes which is usually the case...

Страница 26: ...d Analysing Data 26 In the Event Transient mode an interruption is represented as one event with the following data as shown in the next picture the beginning time duration magnitude which is zero and...

Страница 27: ...he toolbar or by choosing Save option in the Data menu The following Save window will appear Write the name in the Data Name box and click OK For opening an existing data click the Open Data button in...

Страница 28: ...a menu Printing graphs is possible only with Graph window open and by selecting the Print option in the Execute menu Exporting and Importing data is used for transfering data from one computer to anot...

Страница 29: ...ouble insulation Working temperature range 0 C to 40 C Storage temperature range 10 C to 60 C Max working humidity 85 RH 0 C to 40 C 6 2 Measurements Type of Detected Events Voltage Swells Voltage Dip...

Страница 30: ...l to Ground Swells Range 0 155 Vrms Accuracy 2 of reading 2 Vrms Resolution 1 Vrms Transients Range 50 2600 V Accuracy 10 of reading Resolution 5 V Phase Angle Accuracy 10 Phase Angle Resolution 1 Min...

Страница 31: ......

Страница 32: ......

Отзывы: